Open Flash Chart App Introduction
Open Flash Chart is a powerful and versatile tool that empowers web developers to seamlessly integrate dynamic and interactive Flash charts into their websites. This comprehensive guide delves into its functionalities, benefits, and how it can elevate your web development projects.
What is Open Flash Chart?
Open Flash Chart is a robust charting library that allows you to generate a wide array of interactive charts directly from data sources such as text files or databases accessed through various server-side scripting languages. Unlike static images, these charts are dynamic, responding to user interactions and providing a richer, more engaging user experience.
Key Features and Benefits
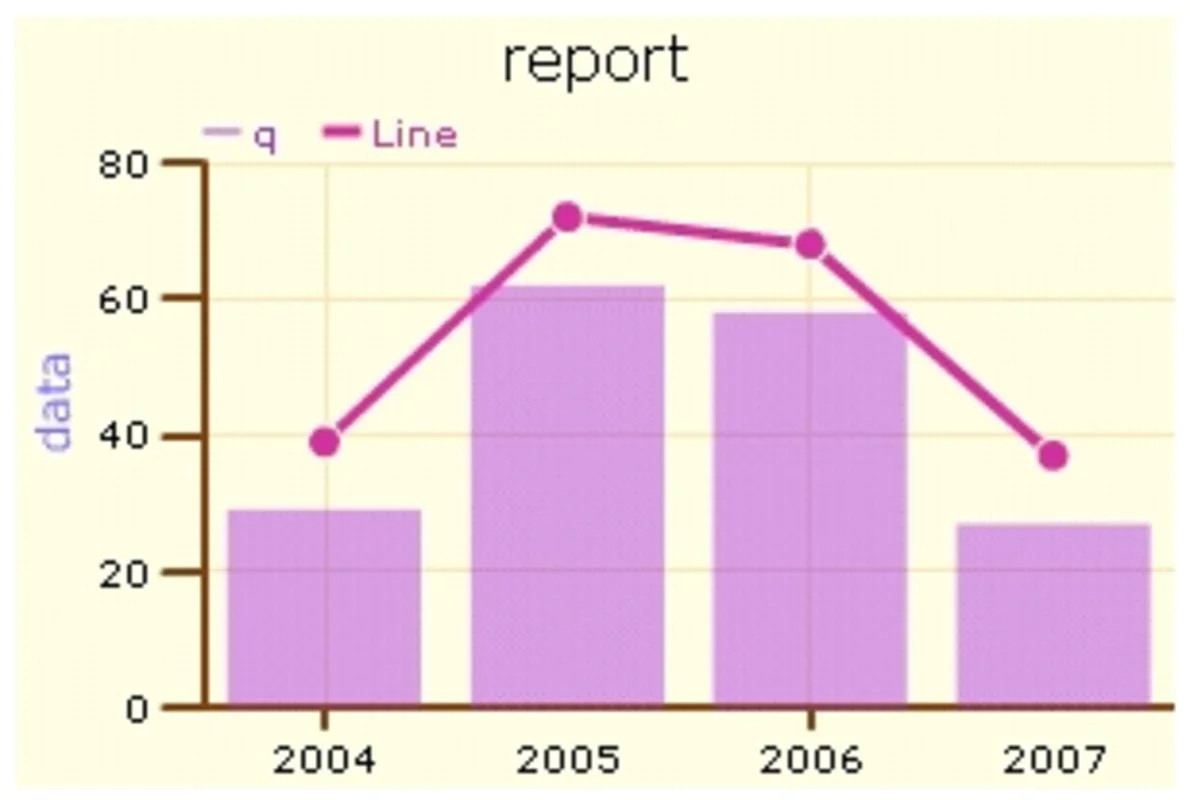
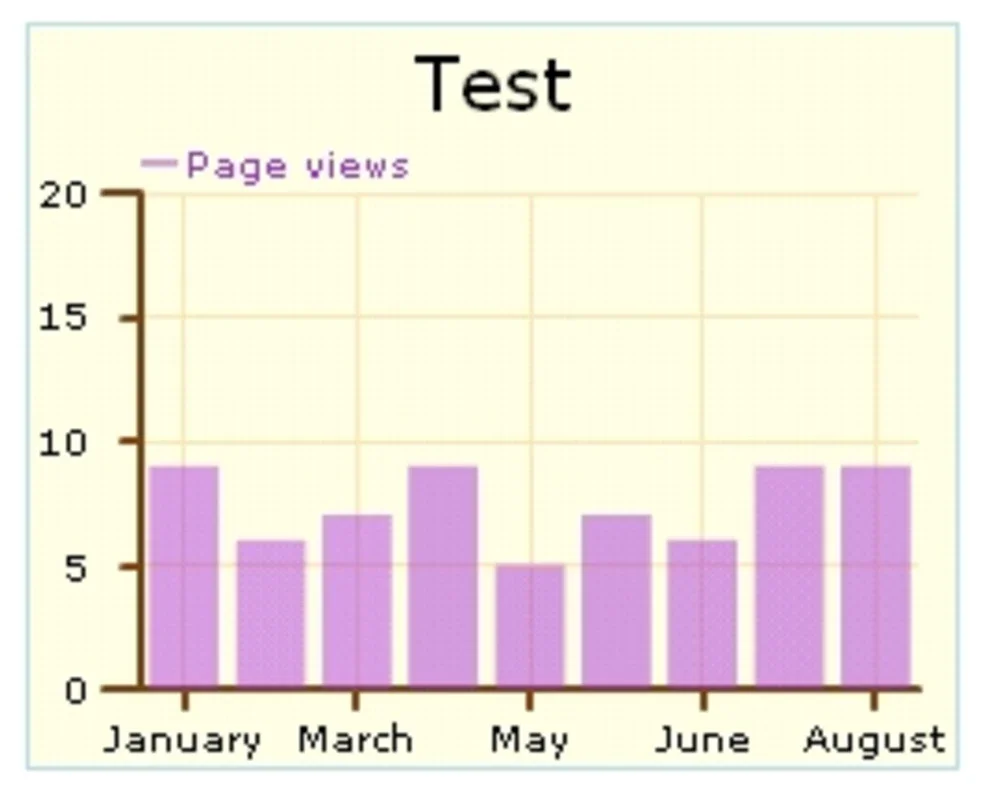
- Diverse Chart Types: Open Flash Chart supports a vast array of chart types, catering to diverse data visualization needs. From simple bar charts and line graphs to complex combinations incorporating pie charts, scatter plots, and more, you have the flexibility to choose the most appropriate representation for your data.
- Data Source Flexibility: The library's compatibility extends beyond simple text files. It seamlessly integrates with popular server-side scripting languages like PHP, Perl, Ruby, Java, Python, and .NET, enabling you to fetch data directly from databases or other data sources.
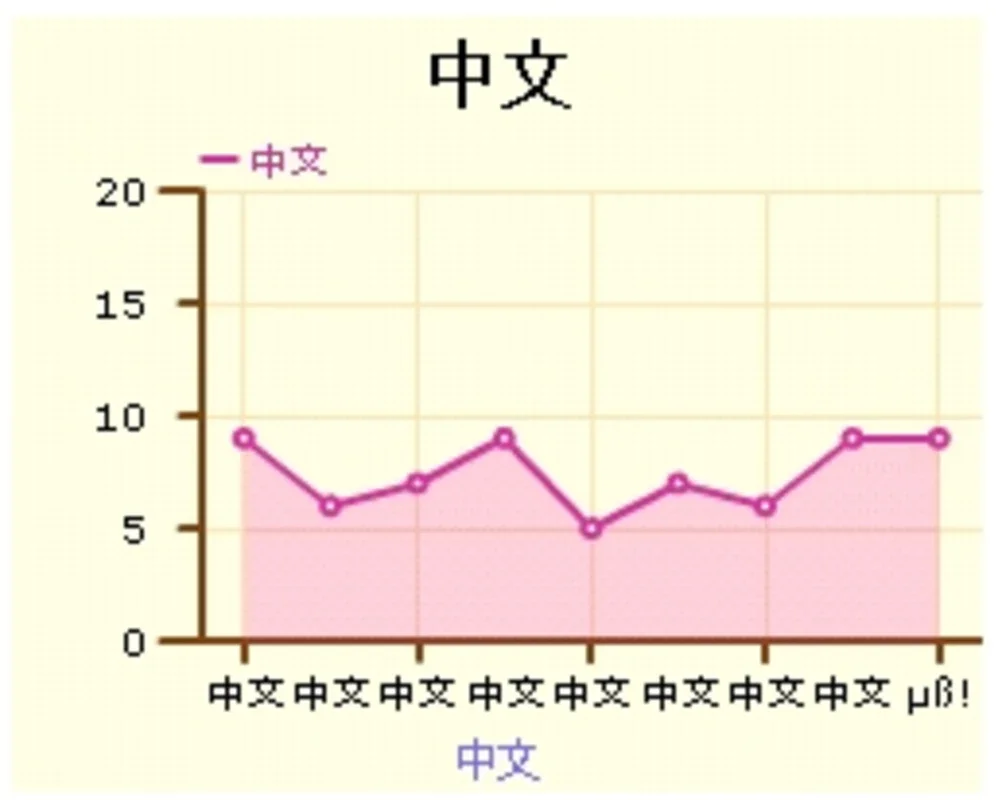
- Customization and Personalization: Open Flash Chart provides extensive customization options. You can tailor the appearance of your charts to match your website's design, adjusting colors, fonts, styles, and adding background images to create a cohesive and visually appealing presentation.
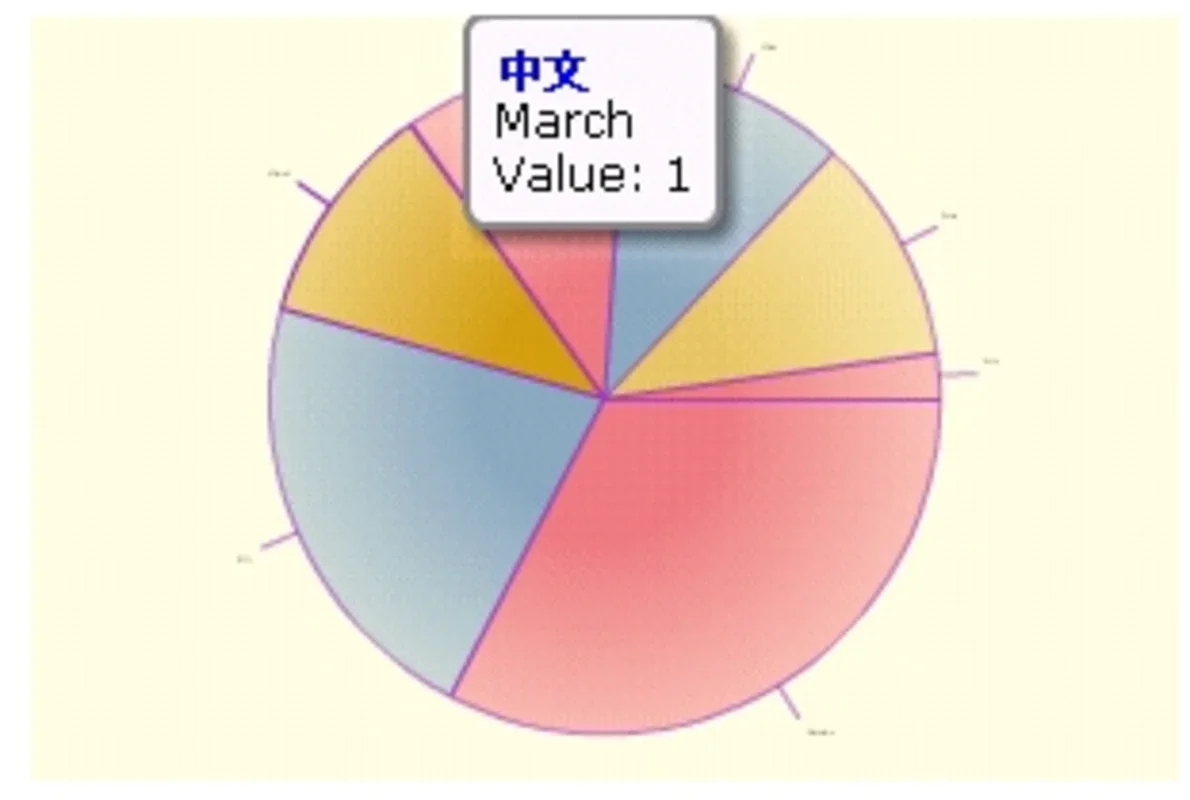
- Interactive Elements: The generated charts are not merely static images; they are interactive. Users can hover over data points to view detailed information, zoom in for closer inspection, and explore the data in a more engaging manner.
- Cross-Platform Compatibility: While the output is in Flash format, the library itself is compatible with various platforms and programming languages, making it a versatile tool for diverse development environments.
Getting Started with Open Flash Chart
Integrating Open Flash Chart into your web projects is straightforward. The process typically involves:
- Data Preparation: Prepare your data in a suitable format, whether it's a text file or data retrieved from a database.
- Choosing a Chart Type: Select the chart type that best represents your data and aligns with your visualization goals.
- Customization: Customize the chart's appearance to match your website's design and branding.
- Integration: Use the appropriate library for your chosen server-side scripting language to generate the chart and embed it into your web page.
Advanced Features and Techniques
Open Flash Chart offers advanced features for experienced developers, including:
- Data Manipulation: Perform data transformations and calculations directly within the library to prepare data for visualization.
- Event Handling: Implement custom event handlers to respond to user interactions, such as clicks or mouseovers.
- Animations and Transitions: Add animations and transitions to enhance the visual appeal and engagement of your charts.
- Integration with Other Libraries: Combine Open Flash Chart with other JavaScript libraries to create even more sophisticated and interactive data visualizations.
Comparison with Other Charting Libraries
While numerous charting libraries exist, Open Flash Chart distinguishes itself through its robust feature set, extensive customization options, and compatibility with a wide range of programming languages. Compared to some JavaScript-based alternatives, Open Flash Chart may offer a different approach, particularly for developers comfortable with server-side scripting and the Flash format. The choice ultimately depends on the specific needs and preferences of the developer.
Conclusion
Open Flash Chart remains a valuable tool for web developers seeking to create dynamic and interactive charts. Its versatility, customization options, and cross-platform compatibility make it a strong contender in the world of data visualization. By understanding its features and capabilities, developers can leverage this library to enhance their web applications with engaging and informative charts.
Troubleshooting and Support
While Open Flash Chart is generally robust, you may encounter issues during integration or customization. Refer to the official documentation for troubleshooting tips and solutions. The community forums or support channels can also be valuable resources for resolving specific problems.
This guide provides a comprehensive overview of Open Flash Chart. Remember to always consult the official documentation for the most up-to-date information and detailed instructions.