IBM SPSS Statistics App Introduction
IBM SPSS Statistics is a powerful and versatile statistical software package designed for researchers, businesses, and anyone needing to analyze and interpret complex data. This comprehensive guide explores its key features, functionalities, and applications, providing a detailed overview of its capabilities and benefits.
Understanding IBM SPSS Statistics
IBM SPSS Statistics (Statistical Package for the Social Sciences) is a leading statistical software application widely used across various fields, including market research, healthcare, education, and government. Its user-friendly interface and extensive analytical capabilities make it a valuable tool for both novice and experienced users.
The software's strength lies in its ability to handle large datasets efficiently, providing a robust platform for conducting advanced statistical analyses. It offers a wide range of statistical procedures, from basic descriptive statistics to complex multivariate analyses, enabling users to gain meaningful insights from their data.
Key Features and Functionalities
IBM SPSS Statistics boasts a rich array of features, catering to diverse analytical needs. Some of its key functionalities include:
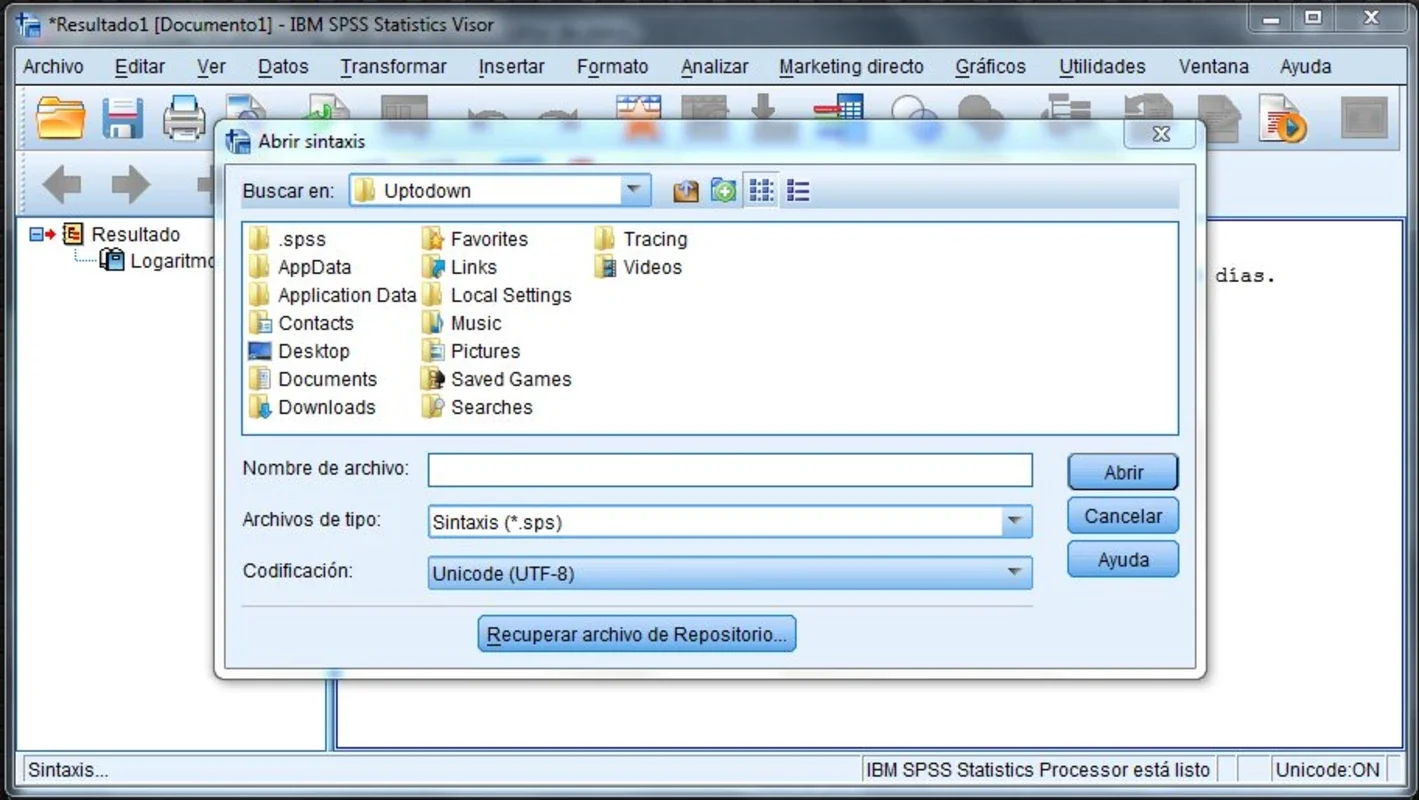
- Data Management: Import, clean, and manage data from various sources, including spreadsheets, databases, and text files. The software provides tools for data transformation, recoding, and handling missing values.
- Descriptive Statistics: Calculate basic descriptive statistics such as mean, median, mode, standard deviation, and frequency distributions. These provide a summary overview of the data.
- Inferential Statistics: Conduct hypothesis testing, confidence intervals, and other inferential statistical analyses to draw conclusions about populations based on sample data. This includes t-tests, ANOVA, chi-square tests, and more.
- Regression Analysis: Perform linear, multiple, and logistic regression analyses to model relationships between variables and predict outcomes. This is crucial for understanding cause-and-effect relationships.
- Multivariate Analysis: Explore complex relationships between multiple variables using techniques such as factor analysis, cluster analysis, and discriminant analysis. This helps uncover underlying patterns and structures in the data.
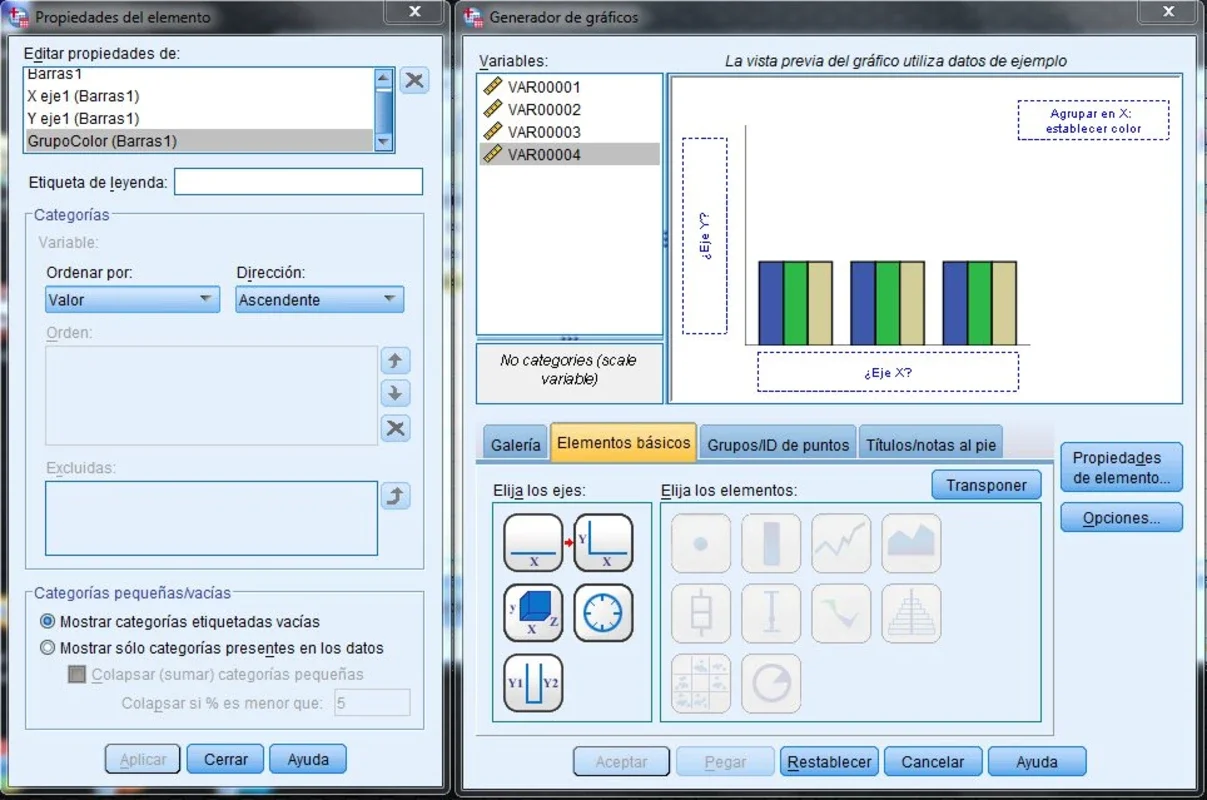
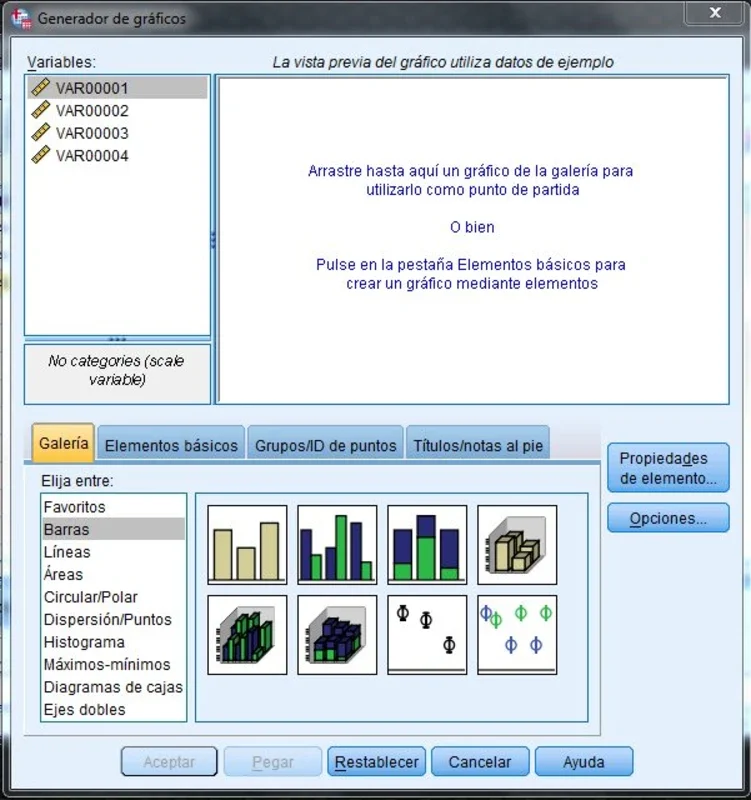
- Data Visualization: Create a variety of charts and graphs to visually represent data and findings. This includes bar charts, histograms, scatter plots, and more, facilitating clear communication of results.
- Customizable Reporting: Generate customized reports to present findings in a clear and concise manner. This includes tables, charts, and narrative summaries.
- Advanced Statistical Procedures: Access advanced statistical procedures such as time series analysis, survival analysis, and structural equation modeling, catering to specialized research needs.
Applications Across Industries
The versatility of IBM SPSS Statistics makes it applicable across a wide range of industries and research areas:
- Market Research: Analyze consumer behavior, preferences, and market trends to inform marketing strategies and product development.
- Healthcare: Analyze patient data to improve healthcare outcomes, identify risk factors, and evaluate the effectiveness of treatments.
- Education: Analyze student performance data to improve teaching methods and educational outcomes.
- Government: Analyze census data, crime statistics, and other government data to inform policy decisions.
- Finance: Analyze financial data to assess risk, predict market trends, and make investment decisions.
Comparison with Other Statistical Software
While several statistical software packages exist, IBM SPSS Statistics stands out due to its user-friendly interface, comprehensive features, and extensive support. Compared to R or Python, which require more programming expertise, SPSS offers a more intuitive approach, making it accessible to a wider range of users. Compared to SAS, SPSS often presents a more streamlined workflow, particularly for users not requiring the most advanced statistical procedures. However, SAS might offer more specialized statistical tools for certain niche applications.
Data Editor and Advanced Features
The data editor in IBM SPSS Statistics is a powerful tool for data manipulation and management. Its intuitive interface allows users to easily enter, edit, and transform data. Beyond basic data entry, the editor facilitates advanced tasks such as:
- Data Transformation: Create new variables based on existing ones, recode variables, and handle missing data using various imputation techniques.
- Data Cleaning: Identify and correct errors in the data, ensuring data quality and reliability.
- Data Subsetting: Create subsets of the data for focused analyses.
- Data Merging: Combine data from multiple sources.
The software also offers advanced features such as:
- Predictive Modeling: Build predictive models to forecast future outcomes based on historical data. This is particularly useful in areas such as customer churn prediction and risk assessment.
- Risk Analysis: Assess and manage risks using statistical modeling techniques.
- Client Identification: Identify and segment clients based on their characteristics and behaviors.
- Cost-Benefit Analysis: Evaluate the costs and benefits of different options.
- Trend Analysis: Identify trends and patterns in data to inform strategic decision-making.
- Fraud Detection: Identify potential fraudulent activities using statistical methods.
- Brand Analysis: Understand customer perceptions and brand associations.
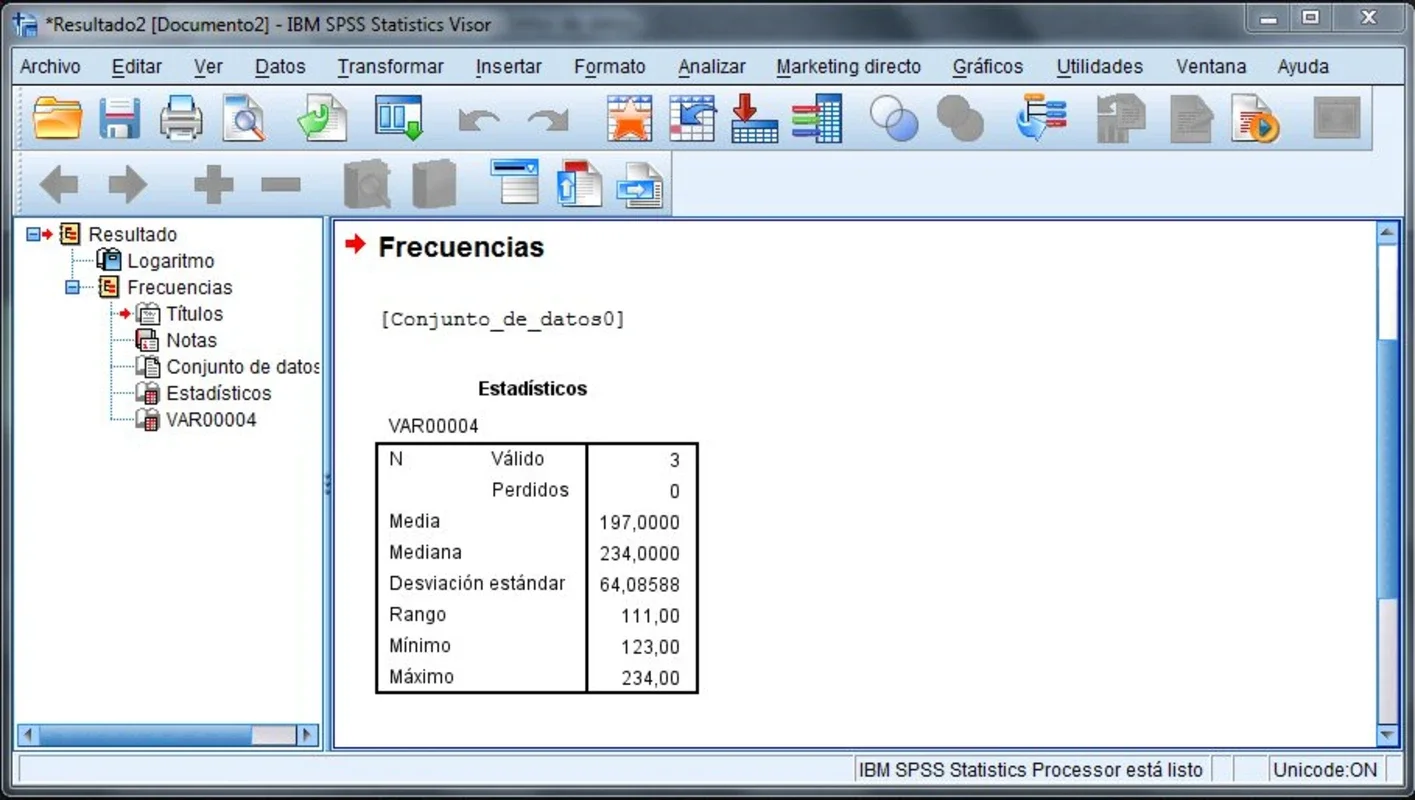
Output and Reporting
IBM SPSS Statistics provides a comprehensive output viewer that displays the results of statistical analyses in a clear and organized manner. The viewer includes tables, charts, and graphs, allowing users to visually represent their findings. Results can be easily exported in various formats, including PDF and DOC, for sharing and archiving.
Conclusion
IBM SPSS Statistics is a powerful and versatile statistical software package that offers a comprehensive suite of tools for data analysis and interpretation. Its user-friendly interface, extensive features, and wide range of applications make it an invaluable asset for researchers, businesses, and anyone needing to extract meaningful insights from data. Its ability to handle large datasets efficiently, coupled with its advanced statistical procedures, positions it as a leading choice in the field of statistical software.