


Microsoft Power BI App Introduction
Microsoft Power BI is a powerful business analytics service that provides interactive visualizations and business intelligence capabilities with an intuitive and user-friendly interface. This comprehensive guide explores its features, benefits, and how it empowers users to transform raw data into actionable insights. Unlike mobile versions which primarily focus on viewing and collaboration, this document centers on the full Windows desktop application, highlighting its extensive analytical capabilities.
Understanding the Power of Microsoft Power BI
At its core, Power BI excels at simplifying complex data analysis. It connects to various data sources – from simple spreadsheets to extensive databases – allowing users to consolidate information from disparate locations. This consolidated data is then transformed into visually compelling reports and dashboards, making it easy to identify trends, patterns, and anomalies that might otherwise be missed.
Key Features and Capabilities:
- Data Connectivity: Power BI seamlessly integrates with numerous data sources, including Excel, SQL Server, Azure, and cloud-based services. This broad compatibility ensures users can access and analyze data from their preferred platforms.
- Data Modeling: The robust data modeling capabilities enable users to create relationships between different datasets, allowing for comprehensive analysis and reporting. Users can define measures, calculate key performance indicators (KPIs), and create custom calculations to tailor their analysis to specific needs.
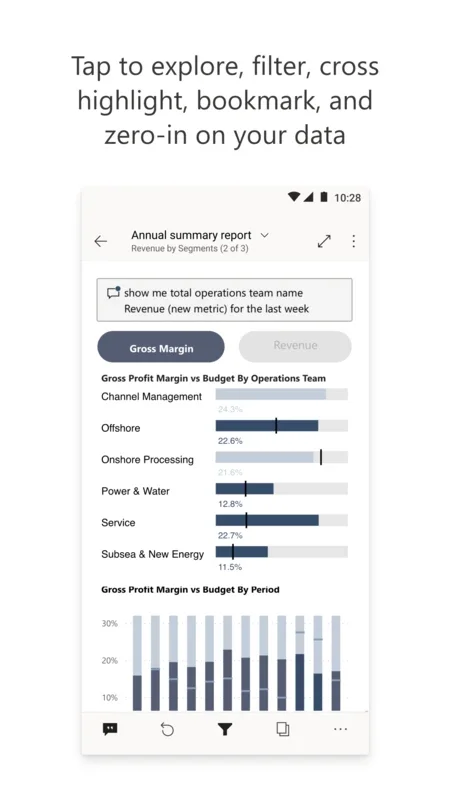
- Data Visualization: Power BI offers a wide array of visualization options, including charts, graphs, maps, and tables. Users can choose the most appropriate visualization to effectively communicate their findings, ensuring clarity and impact.
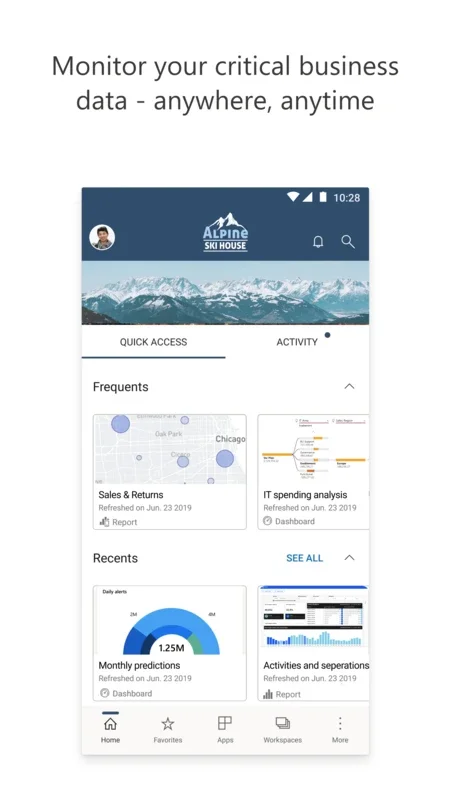
- Interactive Dashboards: Dashboards provide a centralized view of key metrics and insights. Users can interactively explore the data, drill down into details, and gain a deeper understanding of the underlying information.
- Report Creation: Power BI allows users to create comprehensive reports that combine various visualizations and narratives. These reports can be shared with colleagues, stakeholders, and clients, facilitating data-driven decision-making.
- Collaboration and Sharing: Power BI supports seamless collaboration, allowing users to share reports and dashboards with others. This fosters teamwork and ensures everyone has access to the latest insights.
- AI-Powered Insights: Power BI leverages artificial intelligence to provide automated insights and predictions. This helps users identify trends and patterns that might not be immediately apparent.
- Customizable Reports: Users can customize reports to fit their specific needs and preferences. This ensures that the information is presented in a way that is easy to understand and use.
- Data Security: Power BI provides robust data security features to protect sensitive information. Users can control access to reports and dashboards, ensuring that only authorized individuals can view the data.
Comparing Power BI to Other Business Intelligence Tools
Power BI stands out among its competitors due to its ease of use, comprehensive feature set, and strong integration with the Microsoft ecosystem. While tools like Tableau offer similar functionalities, Power BI often provides a more accessible learning curve for users already familiar with Microsoft products. Its integration with Excel, for instance, makes data import and manipulation significantly simpler. Compared to Qlik Sense, Power BI often boasts a more intuitive interface, making it easier for non-technical users to create and interpret data visualizations.
However, for extremely large datasets or highly complex analytical requirements, specialized tools might offer more advanced capabilities. The choice between Power BI and other tools often depends on the specific needs and technical expertise of the user.
Real-World Applications of Microsoft Power BI
The versatility of Power BI makes it applicable across various industries and departments. Here are a few examples:
- Sales and Marketing: Analyze sales data to identify top-performing products, understand customer behavior, and optimize marketing campaigns.
- Finance: Track financial performance, manage budgets, and forecast future trends.
- Human Resources: Analyze employee data to identify trends in hiring, retention, and employee satisfaction.
- Operations: Monitor operational efficiency, identify bottlenecks, and improve processes.
- Healthcare: Analyze patient data to improve patient care, manage resources, and track outcomes.
Getting Started with Microsoft Power BI
The process of getting started with Power BI is straightforward. The Windows desktop application offers a guided experience, making it easy for users to connect to data sources, create visualizations, and build reports. Microsoft provides extensive documentation and tutorials to support users at every stage of their journey. The intuitive interface and drag-and-drop functionality minimize the need for extensive technical expertise.
Conclusion
Microsoft Power BI is a powerful and versatile business intelligence tool that empowers users to unlock the insights hidden within their data. Its ease of use, comprehensive features, and strong integration with the Microsoft ecosystem make it a valuable asset for organizations of all sizes. By transforming raw data into actionable insights, Power BI facilitates data-driven decision-making, leading to improved efficiency, better outcomes, and a competitive advantage in today's data-driven world.