Infostat App Introduction
InfoStat is a powerful and user-friendly statistical analysis software designed for Windows. It caters to both beginners and experienced users, offering a wide range of tools for descriptive statistics, graphical representation, and advanced statistical modeling. This comprehensive guide will explore InfoStat's capabilities, highlighting its ease of use and versatility.
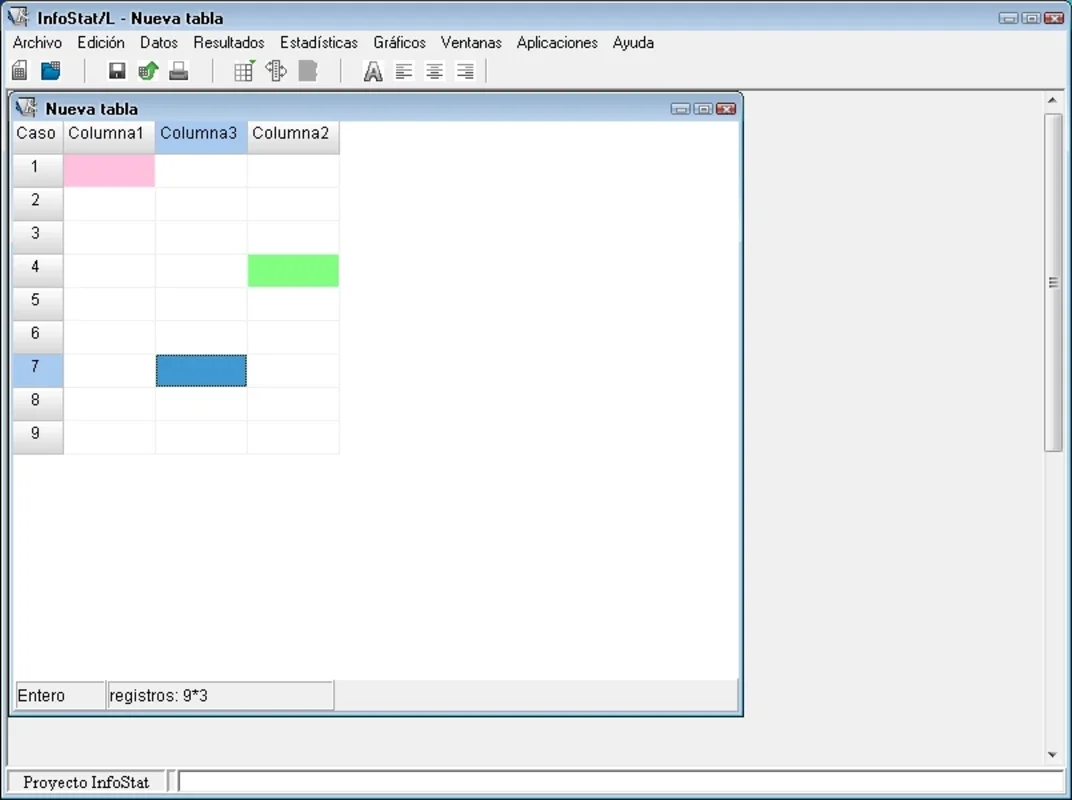
Getting Started with InfoStat
InfoStat's intuitive interface makes it incredibly easy to navigate, even for users with limited statistical experience. The software's clean design ensures that you can quickly locate the tools you need without getting lost in complex menus. The process of importing data is straightforward, supporting various formats including Excel, TXT, DBase, Paradox, and its own native format. This flexibility ensures seamless integration with existing workflows.
Core Features and Functionality
InfoStat's strength lies in its comprehensive suite of statistical tools. Let's delve into some of its key features:
Descriptive Statistics
InfoStat provides a robust set of tools for calculating descriptive statistics, including:
- Measures of central tendency: Mean, median, mode
- Measures of dispersion: Standard deviation, variance, range, interquartile range
- Frequency distributions: Histograms, frequency tables
These descriptive statistics are crucial for understanding the basic characteristics of your data, providing a foundation for further analysis.
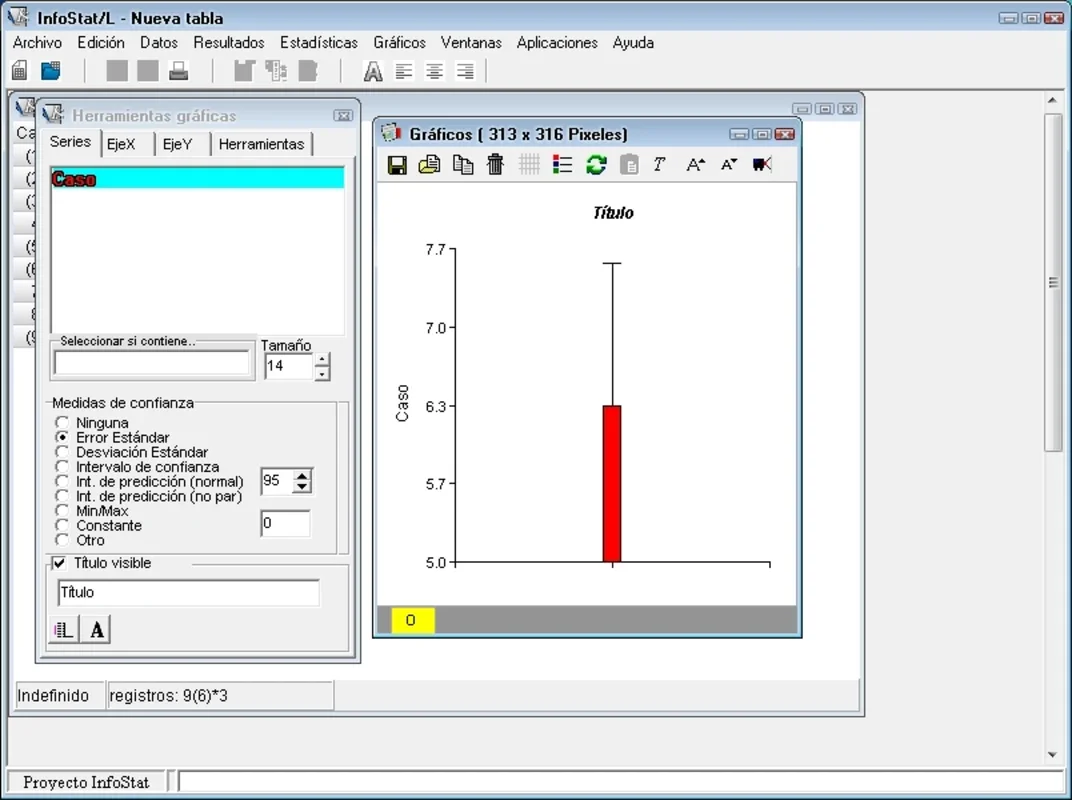
Graphical Representation
Visualizing data is essential for effective communication and interpretation. InfoStat offers a wide variety of graphical tools, including:
- Histograms: To visualize the distribution of a single variable.
- Bar charts: To compare different categories or groups.
- Scatter plots: To explore the relationship between two variables.
- Box plots: To display the distribution of data, including outliers.
- Pie charts: To show the proportion of different categories.
The software's ease of use allows users to create professional-quality graphs with minimal effort, enhancing the clarity and impact of their analysis.
Advanced Statistical Modeling
Beyond basic descriptive statistics and graphical representation, InfoStat also offers advanced statistical modeling capabilities, including:
- Regression analysis: To model the relationship between a dependent variable and one or more independent variables.
- Analysis of variance (ANOVA): To compare the means of different groups.
- Multivariate analysis: Techniques such as principal component analysis (PCA) and factor analysis.
These advanced methods allow for more in-depth analysis and the identification of complex relationships within the data.
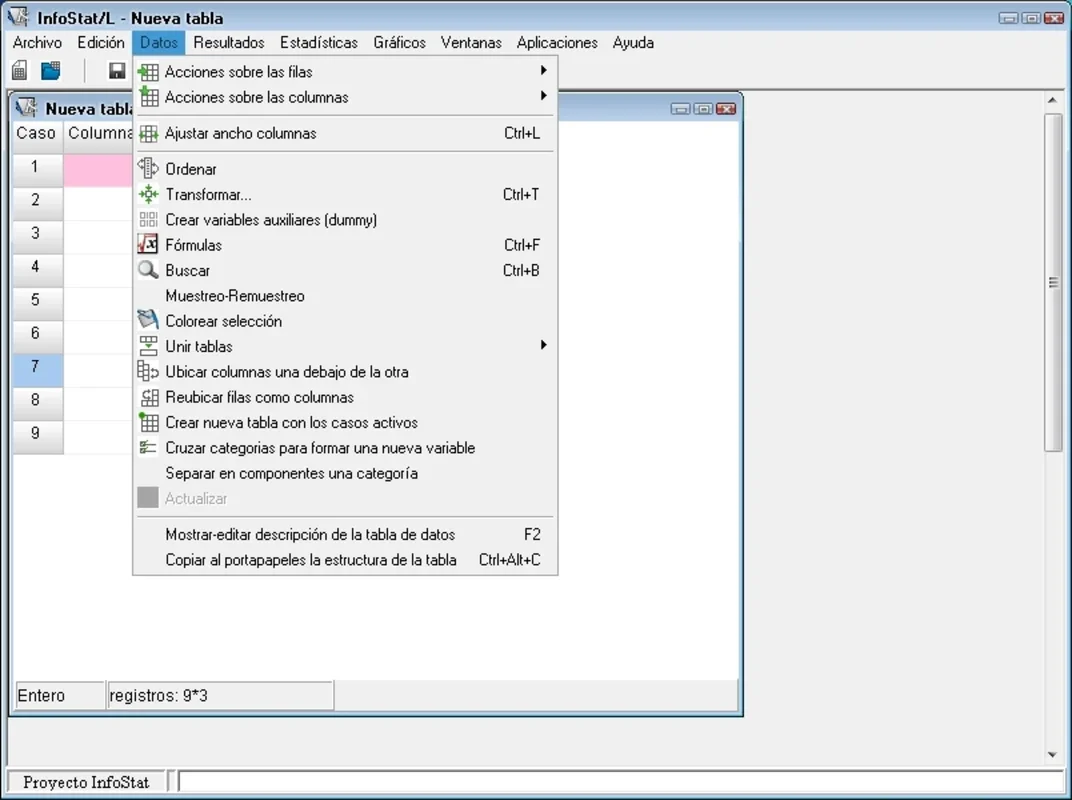
Data Management and Export
InfoStat simplifies data management with its efficient import and export capabilities. The software supports a variety of file formats, ensuring compatibility with other applications. This allows for seamless integration with other software and facilitates the sharing of results.
Comparing InfoStat to Other Statistical Software
InfoStat stands out from other statistical software packages due to its user-friendly interface and comprehensive feature set. While some packages like SPSS or R offer more advanced functionalities, they often come with a steeper learning curve. InfoStat strikes a balance between power and accessibility, making it an ideal choice for users who need a versatile yet easy-to-use tool.
Compared to simpler spreadsheet software with basic statistical functions, InfoStat provides a much more comprehensive and sophisticated set of analytical tools, without the complexity of high-end statistical packages. It's a middle ground that caters to a wide range of users and analytical needs.
Who Should Use InfoStat?
InfoStat is an excellent choice for a variety of users, including:
- Students: Its ease of use and comprehensive features make it an ideal tool for learning and applying statistical concepts.
- Researchers: It provides the necessary tools for conducting a wide range of statistical analyses.
- Business professionals: It can be used to analyze business data and make informed decisions.
- Anyone interested in data analysis: Its user-friendly interface makes it accessible to anyone interested in exploring data.
Conclusion
InfoStat is a valuable asset for anyone involved in statistical analysis. Its combination of a user-friendly interface, comprehensive features, and versatile data handling capabilities makes it a powerful and accessible tool for a wide range of users. Whether you're a student, researcher, or business professional, InfoStat provides the tools you need to effectively analyze your data and draw meaningful conclusions. Its ability to handle various data formats and produce clear, informative visualizations makes it a standout choice in the world of statistical software.
This software is a valuable addition to any data analyst's toolkit, offering a balance between ease of use and powerful analytical capabilities. Its intuitive design and comprehensive features make it an excellent choice for both beginners and experienced users alike. The ability to seamlessly integrate with other software and export results in various formats further enhances its practicality and versatility.