Visual Stats App Introduction
Visual Stats is a powerful and user-friendly application designed specifically for Windows users who are in need of a comprehensive statistical editing solution. This software goes beyond the ordinary, providing a seamless and intuitive work environment that rivals even the most popular spreadsheet applications.
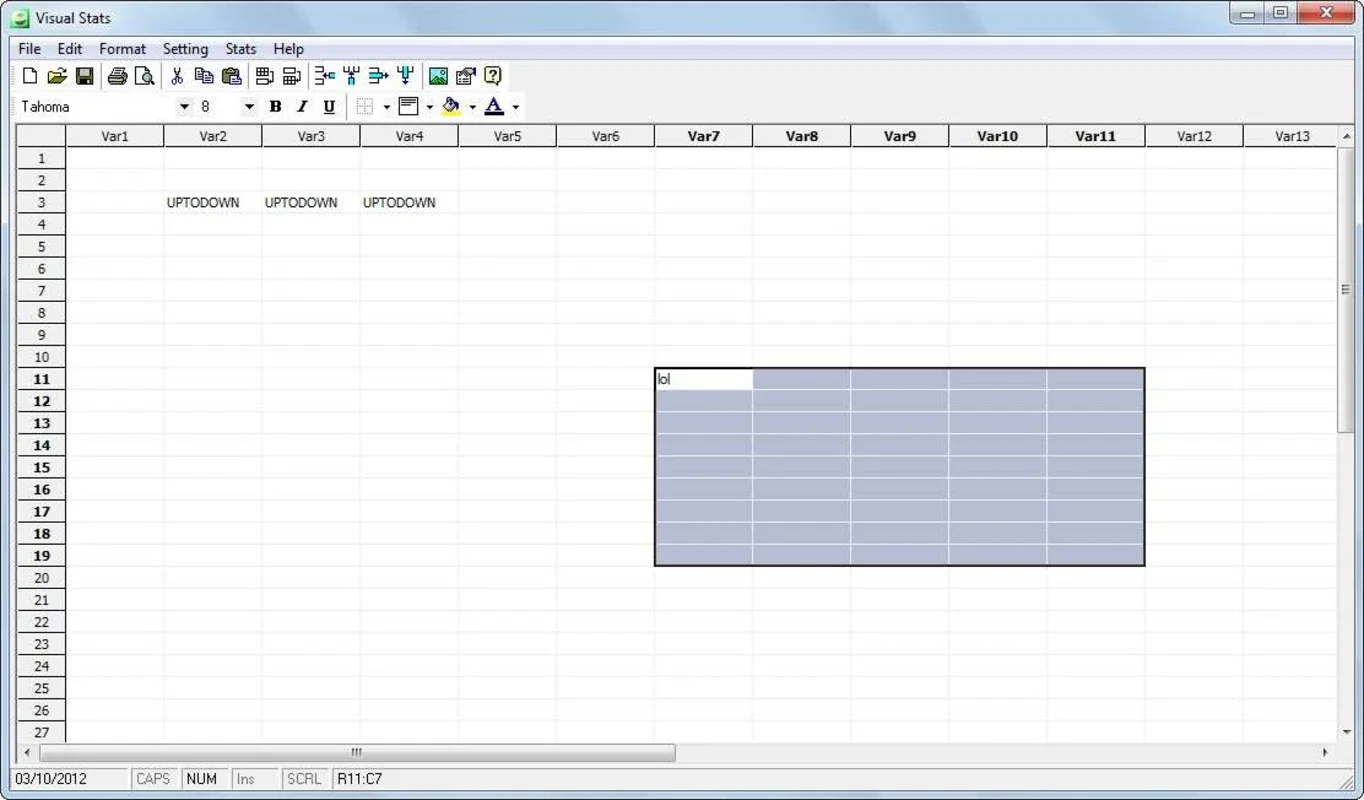
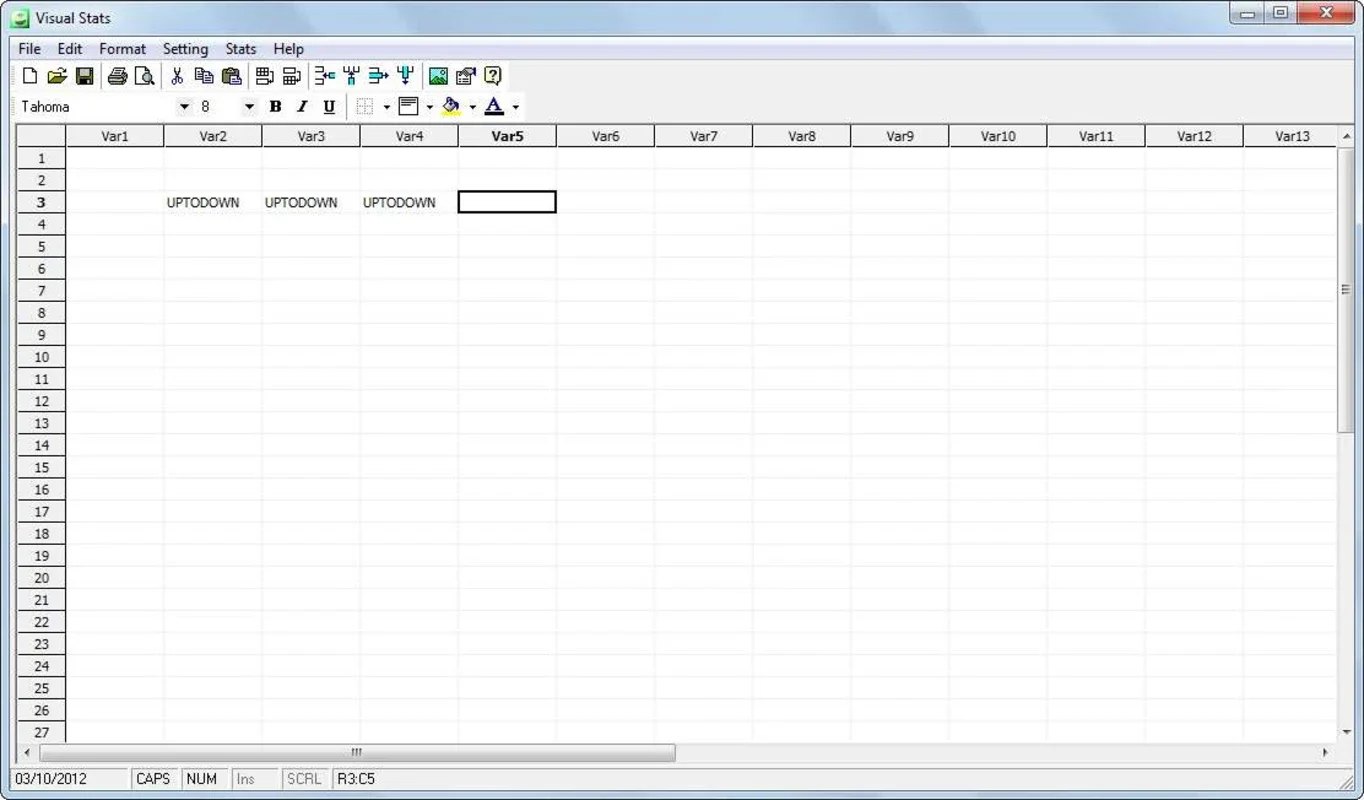
Intuitive Interface Similar to Excel
One of the standout features of Visual Stats is its interface, which bears a resemblance to Excel. This familiar layout allows users to quickly adapt and access an intuitive work environment that is brimming with possibilities. Just like in Excel, users can create a plethora of functions and equations, and freely fill the grid cells with a wide range of operations, opening up an immense array of potential.
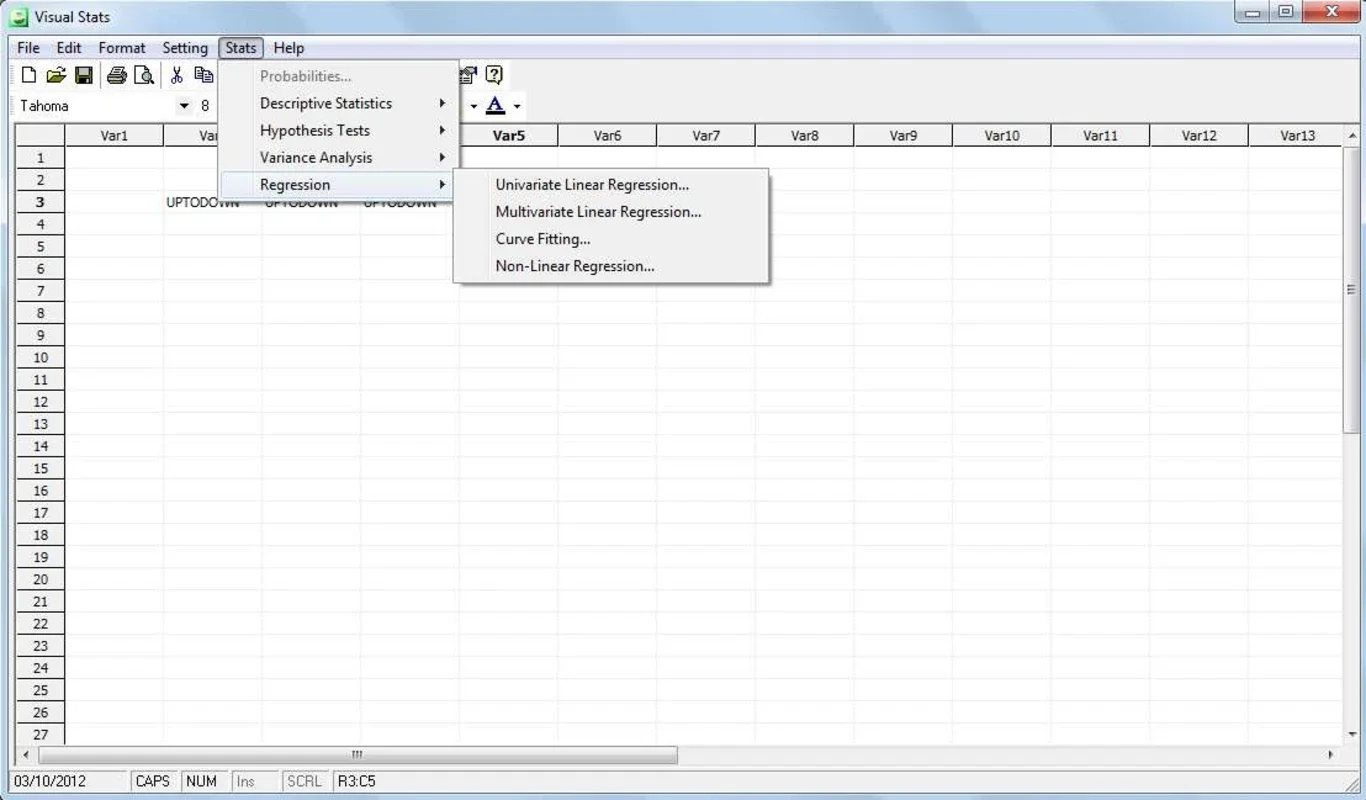
Diverse Functionality for Creating and Editing Statistics
Not only does Visual Stats offer the ability to create and manipulate functions and equations, but it also provides extensive options for creating different types of variables. Users can apply nearly a dozen different options to these variables, further expanding the software's capabilities in statistical analysis and manipulation.
Customizable Work Grid
Another notable aspect of Visual Stats is the flexibility it offers when it comes to configuring the work grid. Users have a number of options at their disposal, including the ability to make changes such as adjusting the color, font, and number of cells. Additionally, they can manually manage the grid to suit their specific needs, providing a personalized and efficient working experience.
In conclusion, Visual Stats is not just another statistical editing tool; it is a game-changer for Windows users seeking a reliable, feature-rich, and easy-to-use solution for their statistical needs. Whether you are a student, researcher, or professional, Visual Stats is the ideal choice for all your statistical editing and creation requirements.