Esta+ App Introduction
Esta+ is a remarkable free statistics program that offers a wide range of features and capabilities. It is specifically focused on descriptive statistics, allowing users to make in-depth analyses and create various diagrams using distributed data in one-dimensional or two-dimensional variables, whether in discreet or continuous mode.
Data Format Amplitude
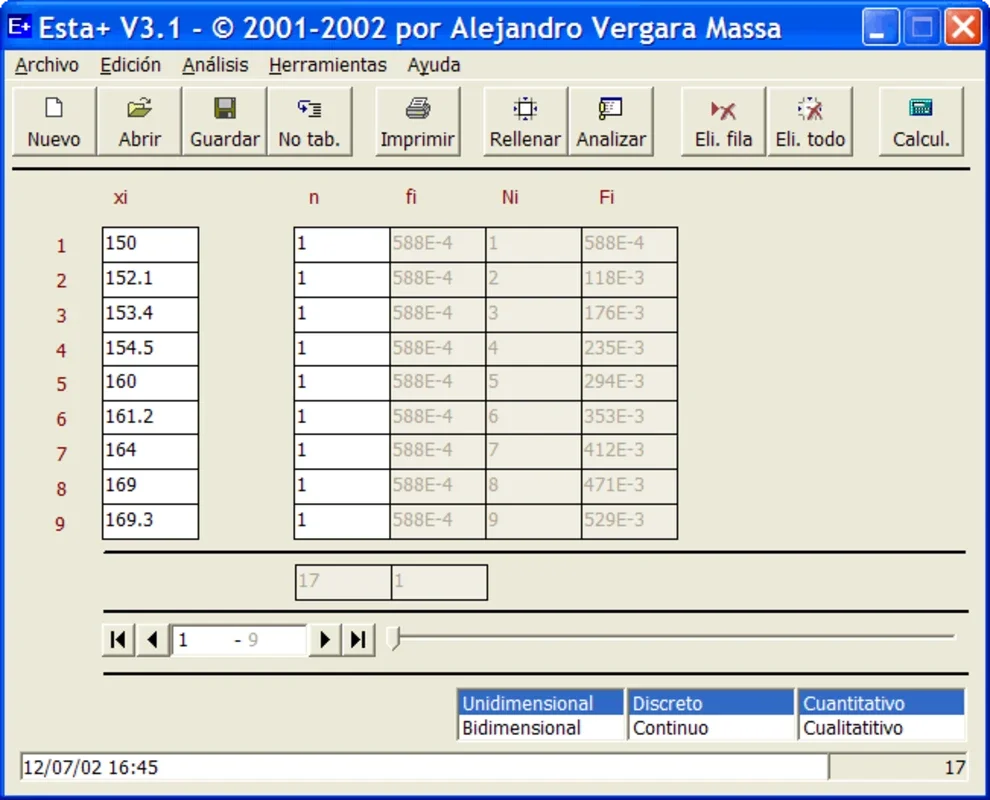
Esta+ can handle a variety of data formats. It supports one-dimensional or two-dimensional variables, both discreet and continuous (grouped in intervals). It also accommodates quantitative and qualitative data, as well as the introduction of tabular or non-tabular data. This flexibility makes it suitable for a wide range of data analysis tasks.
Saving Characteristics
When it comes to saving data, Esta+ has you covered. You can save and print data tables with ease, ensuring that your analysis results are easily accessible. Additionally, it allows you to save and print analysis reports, providing a comprehensive record of your work. You can also import tables from spreadsheets in the Spread-sheet format defined by tabs, making it seamless to integrate data from other sources.
Editing Characteristics
During data insertion, Esta+ performs automatic error checks to ensure the accuracy of your data. It also offers automatic completion of data tables, saving you time and effort. With complete control over the edition of data tables, you can make precise edits and modifications as needed.
In-depth Data Table Analysis
Esta+ provides extensive in-depth analysis of data tables. It measures central tendency, dispersion characteristics, form characteristics, identifies outliers, analyzes functional dependencies, performs regression analysis, and measures statistic dependencies. It also allows for the analysis of percentiles and moments, giving you a comprehensive understanding of your data.
Diagram Creation
Creating diagrams is a breeze with Esta+. It offers features such as boxplots and dispersion diagrams, allowing you to visually represent your data and gain insights at a glance. These diagrams help you present your analysis results in a more engaging and understandable way.
Other Characteristics
Esta+ comes with useful features like online help with the description or statistical formulas, providing quick access to information when needed. It also includes a probabilities assistant to assist you in various statistical calculations. And with editions available for both Windows and Linux PC, you can use it on your preferred operating system.
In conclusion, Esta+ is a comprehensive and powerful statistics program that offers a wide range of features for data analysis and diagram creation. Whether you are a student, researcher, or professional, Esta+ can help you make sense of your data and present your findings effectively.