Sonic Visualiser App Introduction
Introduction to Sonic Visualiser
Sonic Visualiser is a remarkable software that has been designed with a specific set of users in mind. It caters to those who are interested in delving deep into the analysis of audio files. Whether you are a music student, a sound engineer, or simply an audio enthusiast, Sonic Visualiser offers a plethora of features that can enhance your understanding and interaction with audio.
Features of Sonic Visualiser
Audio Wave and Spectogram Viewing
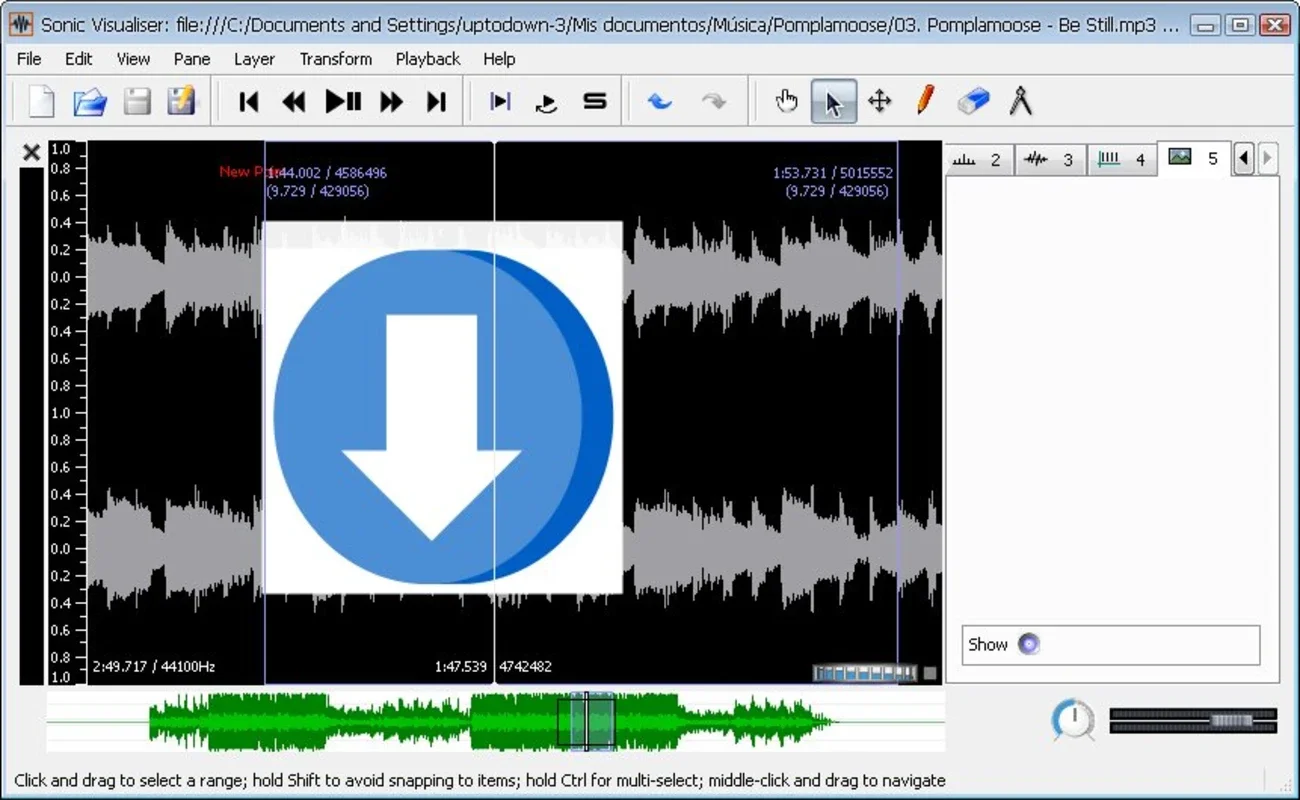
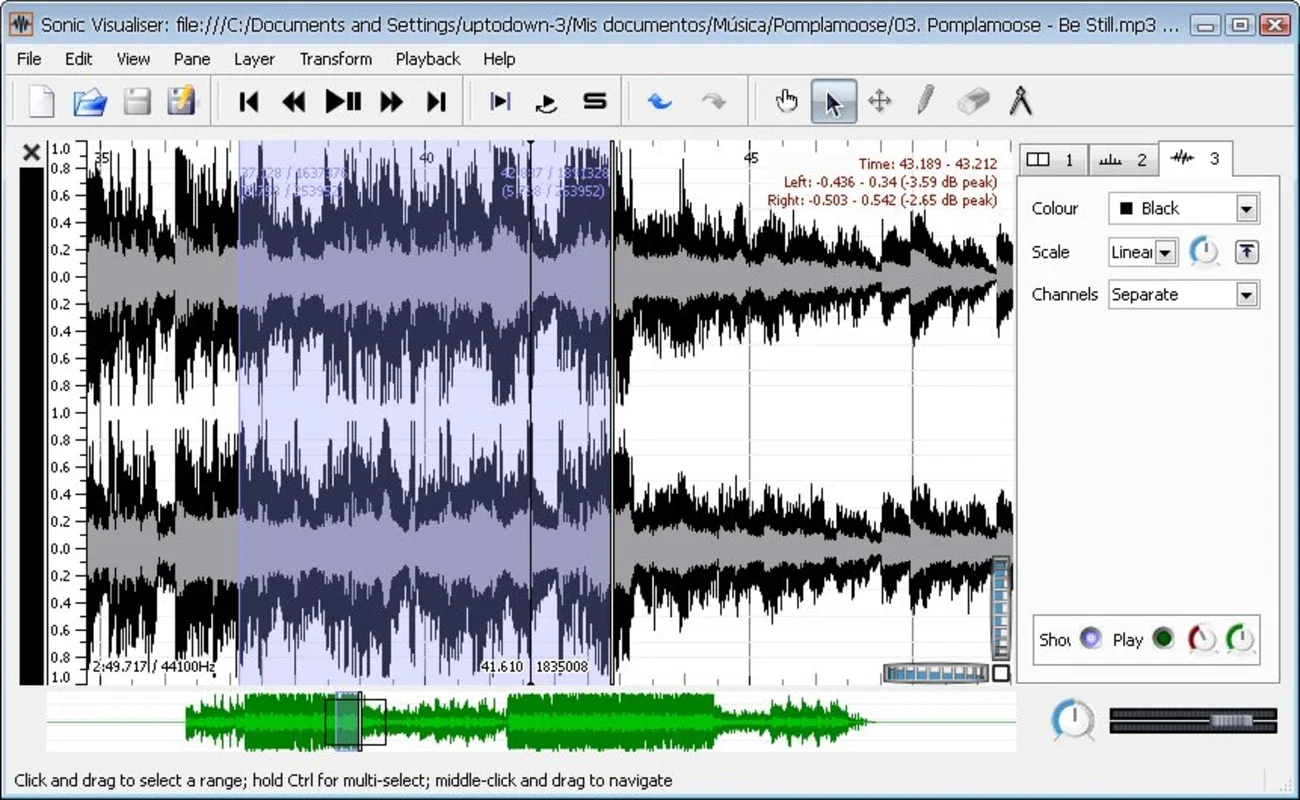
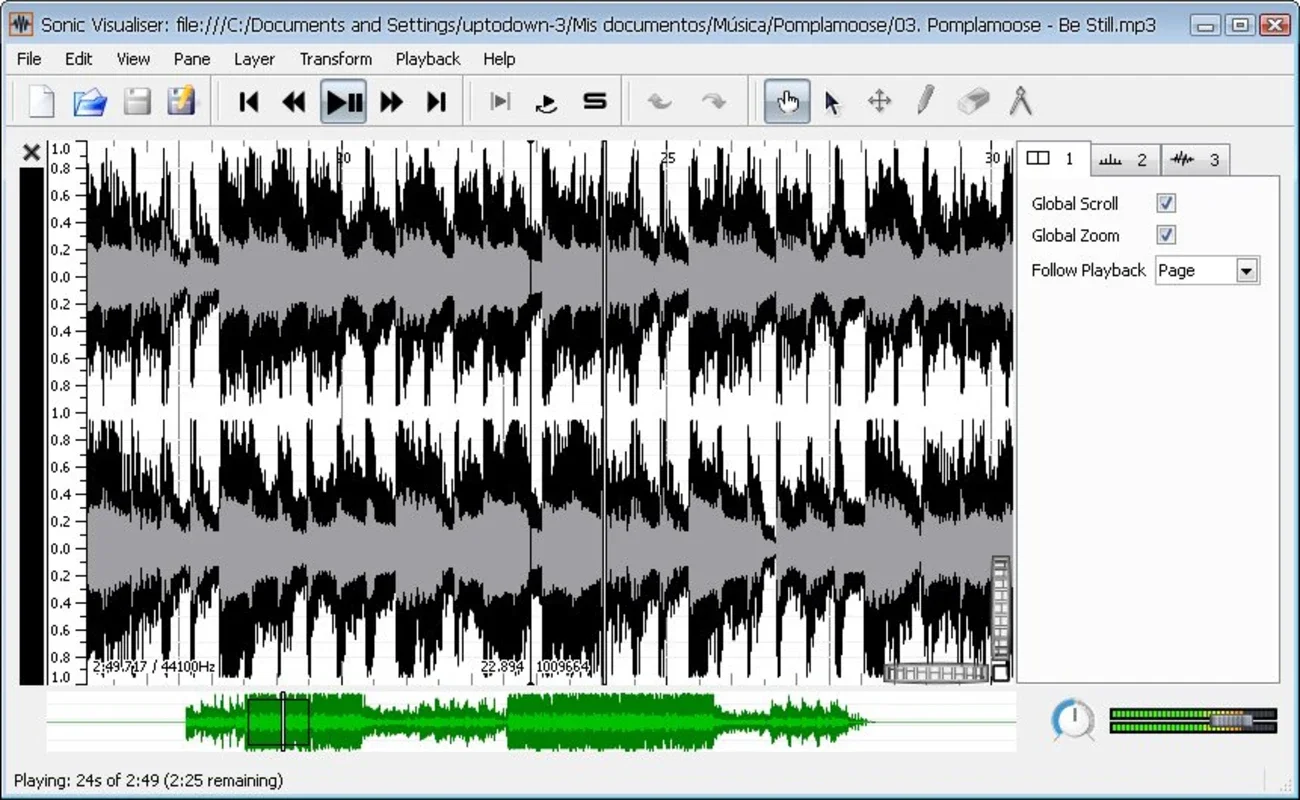
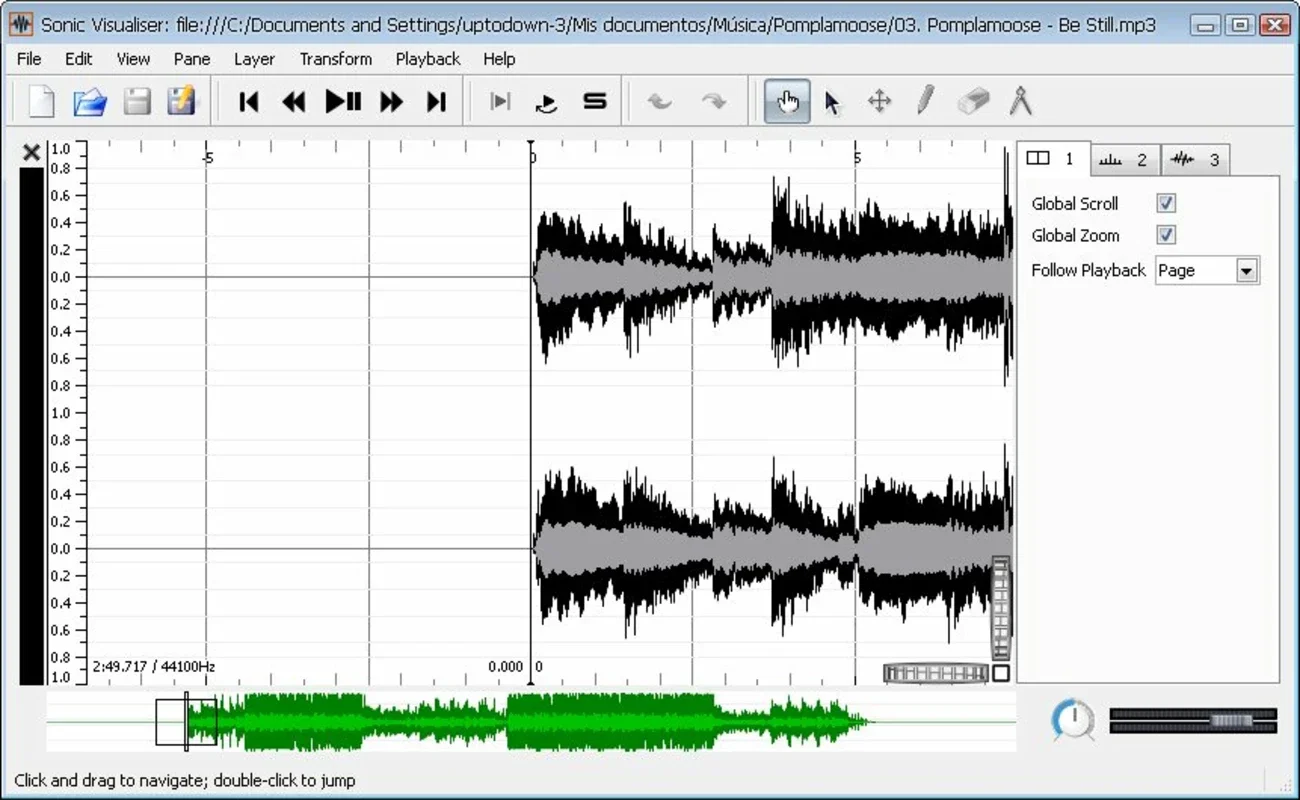
One of the most prominent features of Sonic Visualiser is its ability to display the shape of the audio wave or the spectogram of various audio file formats such as MP3, OGG, and WAV. This visual representation of the audio data provides valuable insights into the composition of the sound. For example, by looking at the audio wave, one can identify the different amplitudes and frequencies present in the sound. The spectogram, on the other hand, gives a more detailed view of the frequency distribution over time, which can be extremely useful in analyzing complex sounds.
On - the - Fly Note - Taking
Another interesting aspect of Sonic Visualiser is the ability to take notes while listening to an audio file. This feature is especially handy for those who are studying a particular track or trying to analyze the different elements of a song. You can add notes at any point during the playback of the audio, and these notes can be used to mark important sections, identify specific sounds, or jot down any observations that come to mind. Additionally, the option to attach images to different parts of the song further enhances the note - taking capabilities. This can be used, for instance, to attach a picture of the musical instrument that is being played at a particular moment or to add a visual reference related to the sound.
Layer - Based Work
Sonic Visualiser also allows users to work with layers. This provides an extra level of control over the notes, time lapses, and other elements of the audio analysis. Layers can be used to separate different aspects of the audio, such as the melody, the harmony, or the percussion. By working with layers, users can focus on specific elements of the sound and analyze them more effectively. For example, a music producer might use layers to isolate the vocal track from the background music in order to make adjustments or analyze the performance of the singer.
Use Cases of Sonic Visualiser
Music Education
In the field of music education, Sonic Visualiser can be a valuable tool. Teachers can use it to demonstrate various concepts related to sound, such as frequency, amplitude, and harmony. Students can also use it to analyze different musical pieces, identify the different instruments used, and understand the structure of the music. For example, a music theory class can use Sonic Visualiser to study the chord progressions in a song by looking at the audio wave and the spectogram.
Sound Engineering
Sound engineers can benefit from Sonic Visualiser in several ways. It can be used to analyze the audio quality of a recording, identify any issues such as noise or distortion, and make the necessary adjustments. For instance, by looking at the spectogram, an engineer can detect any unwanted frequencies and take steps to remove them. Additionally, Sonic Visualiser can be used in the mixing process to ensure that different elements of the sound, such as the vocals, the instruments, and the background music, are balanced properly.
Audio Enthusiasts
For audio enthusiasts, Sonic Visualiser offers a unique way to explore and understand their favorite music. They can use it to discover new aspects of the songs they love, such as hidden melodies or unique sound effects. It also allows them to share their findings with other enthusiasts, creating a community of people who are interested in the in - depth analysis of audio.
Comparison with Other Audio Analysis Tools
When compared to other audio analysis tools, Sonic Visualiser stands out in several ways. Some other tools may offer similar features such as audio wave and spectogram viewing, but Sonic Visualiser's on - the - fly note - taking and layer - based work give it an edge. For example, many other tools do not have the ability to attach images to the audio, which can be a very useful feature in certain situations. Additionally, Sonic Visualiser's user - friendly interface makes it accessible to a wider range of users, including those who may not have extensive technical knowledge.
Conclusion
Sonic Visualiser is a powerful and versatile software that offers a unique set of features for audio analysis. Whether you are in the field of music education, sound engineering, or simply an audio enthusiast, it can be a valuable addition to your toolkit. Its ability to display audio waves and spectograms, along with its note - taking and layer - based work features, make it a standout choice for those who want to gain a deeper understanding of audio files.