Zeraki Analytics App Introduction
Introduction
Zeraki Analytics is a remarkable software that has been making waves in the educational sector. It is designed to transform the way academic performance is analyzed, especially in schools. This software is not just another tool; it is a comprehensive solution that caters to the needs of educators, institutions, students, and parents alike.
The Problem with Traditional Academic Data Analysis
Traditionally, analyzing academic data has been a cumbersome process. Educators often had to deal with large amounts of data presented in tabular formats. This made it difficult to spot trends and patterns quickly. For example, when looking at student grades over a semester, it could be a challenge to see how different factors such as attendance, participation, and test scores correlated. Moreover, communicating these findings to students and parents was not always seamless. There was a lack of an efficient system that could present the data in an understandable and actionable way.
How Zeraki Analytics Solves These Issues
Zeraki Analytics comes in as a game - changer. It simplifies the process of sifting through academic data. Instead of spending hours poring over spreadsheets, educators can use the intuitive features of Zeraki Analytics. For instance, the mark sheets, graphs, and pre - formatted tables make it easy to visualize data. This allows educators to quickly identify trends and patterns that might have been overlooked in traditional methods. Generating comprehensive report forms is no longer a time - consuming task. Educators can effortlessly create reports that are not only accurate but also easy to understand.
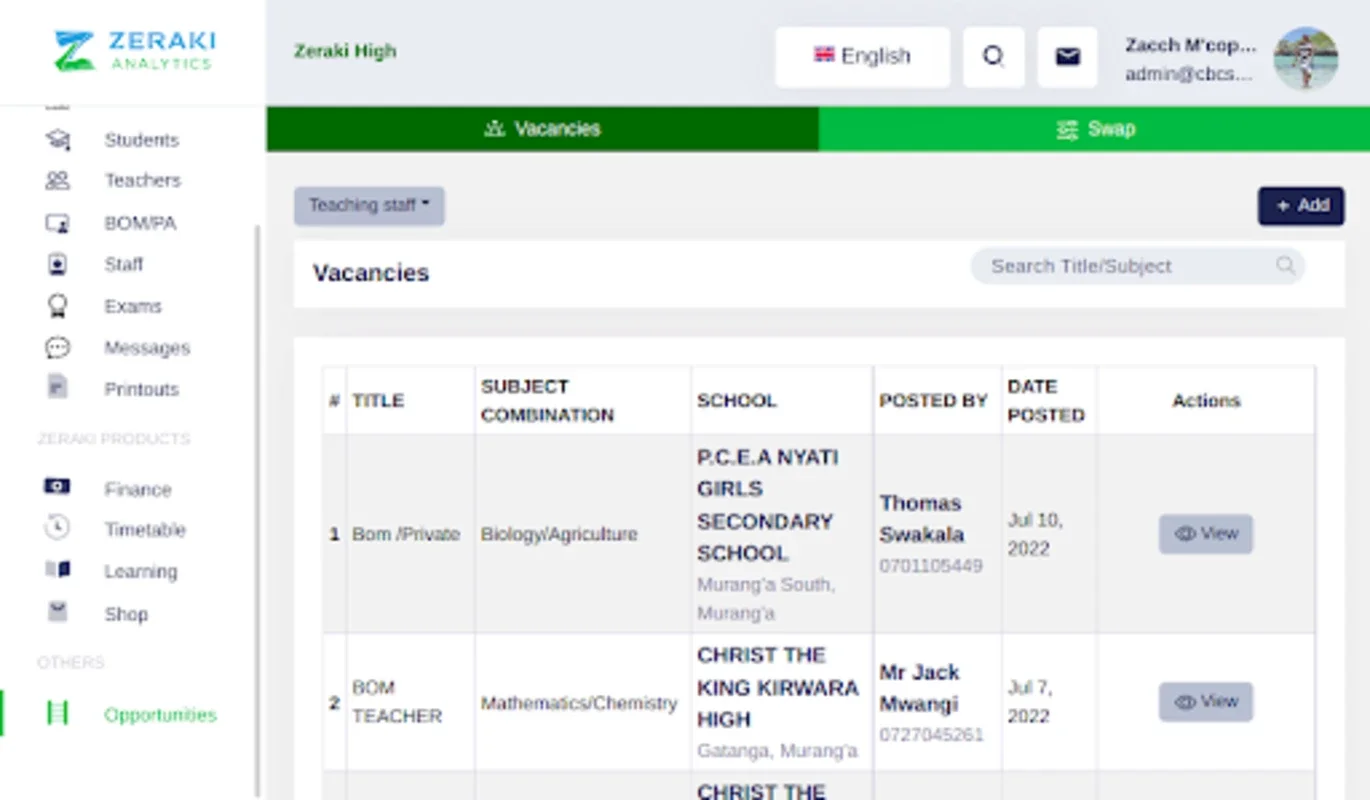
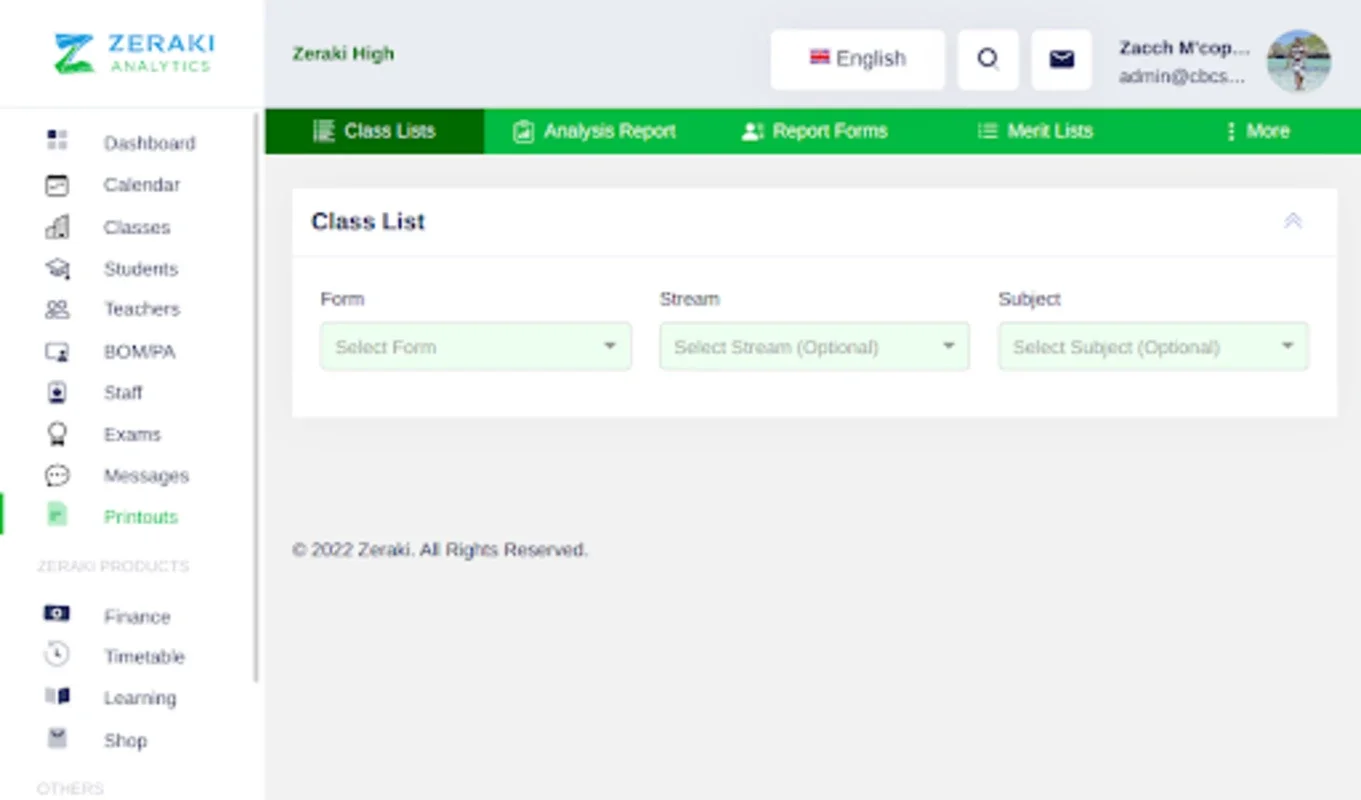
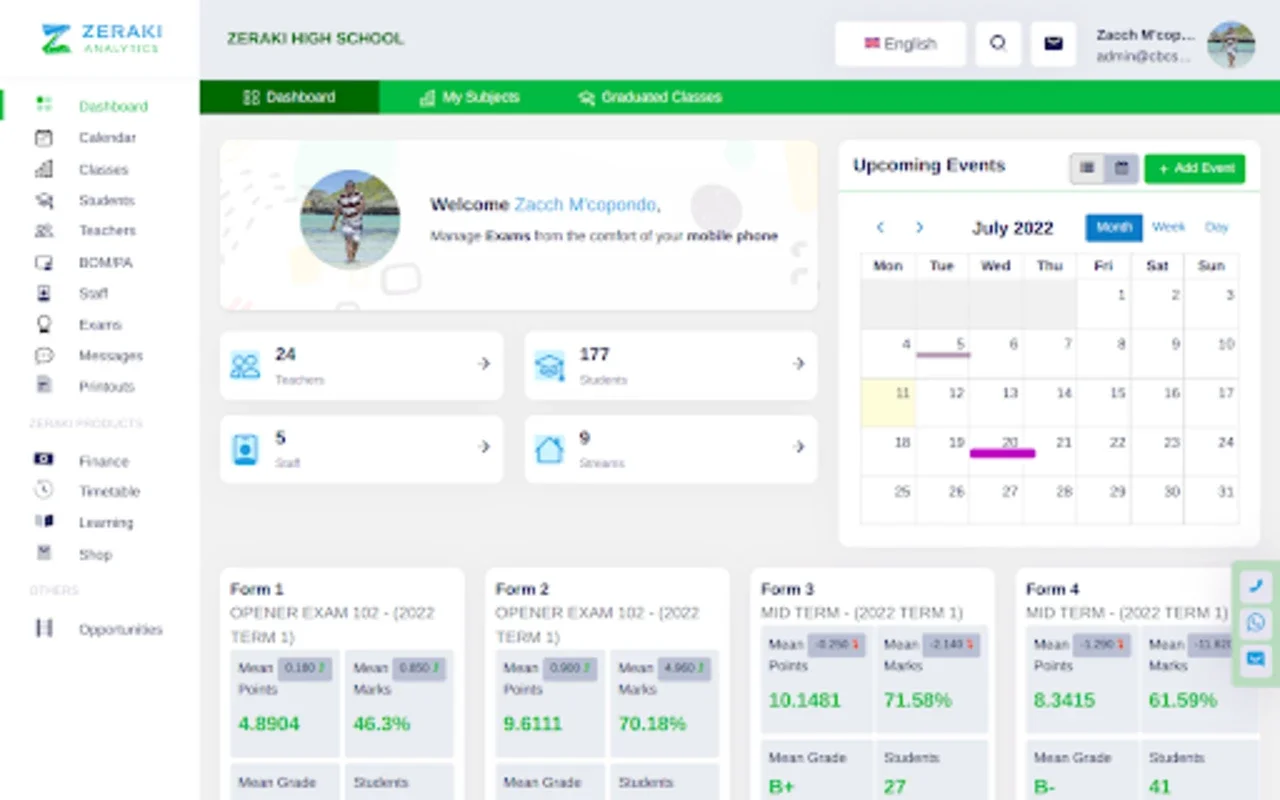
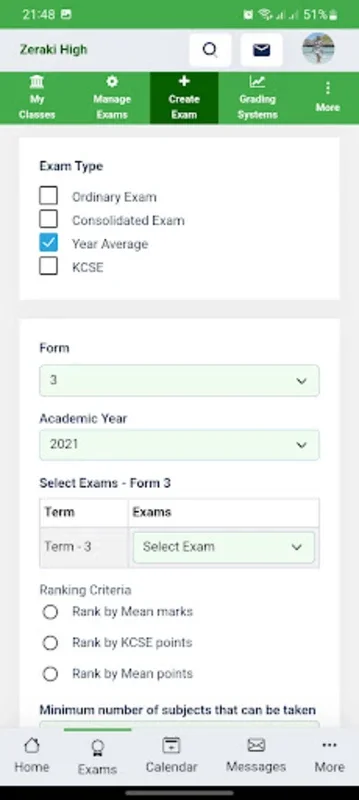
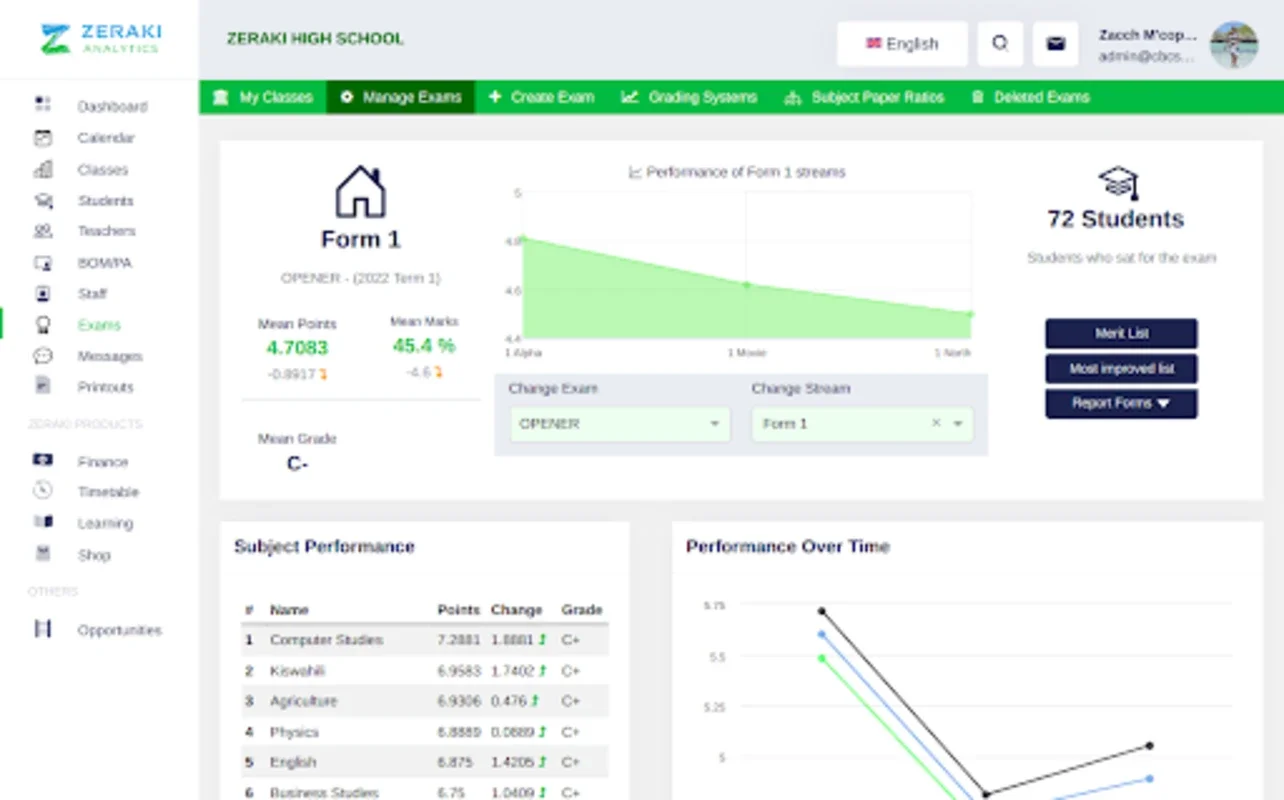
Features of Zeraki Analytics
Mark Sheets
The mark sheets in Zeraki Analytics are designed to be user - friendly. They present the data in a clear and organized manner. Educators can easily input and view student grades, along with other relevant information such as attendance and participation. This helps in getting a holistic view of a student's performance.
Graphs
Graphs are a powerful tool for data visualization. Zeraki Analytics offers a variety of graph types that can be used to represent academic data. For example, a bar graph can be used to compare the performance of different students in a particular subject. A line graph can show the progress of a student over time. These graphs make it easier for educators to analyze data and draw conclusions.
Pre - Formatted Tables
Pre - formatted tables are another great feature. They are designed to present data in a way that is easy to read and understand. These tables can be customized according to the needs of the educator. For example, a table can be created to show the average grades of students in different classes or subjects.
The Impact on Educators
Zeraki Analytics has a significant impact on educators. By simplifying the data analysis process, it allows them to focus more on teaching. Instead of spending a large amount of time on administrative tasks related to data analysis, they can use that time to prepare better lessons, interact with students, and improve the overall learning experience. For example, an educator can quickly identify students who are struggling in a particular subject and provide them with additional support.
The Impact on Students and Parents
Students and parents also benefit from Zeraki Analytics. Students can get a better understanding of their performance through the clear visualizations provided by the software. They can see their strengths and weaknesses and work on improving. Parents, on the other hand, can be more informed about their child's academic progress. This can lead to better communication between parents, students, and educators, ultimately enhancing the educational experience.
Zeraki Analytics and Educational Institutions
Educational institutions can use Zeraki Analytics to improve their overall analysis procedures. By having a more efficient system in place, they can make better - informed decisions. For example, they can identify areas where students are generally struggling and take steps to improve the curriculum or teaching methods. This can lead to an overall improvement in the quality of education provided by the institution.
Conclusion
Zeraki Analytics is a powerful software that has the potential to revolutionize academic performance analysis. It offers a range of features that simplify the process of analyzing academic data, enhance communication between all stakeholders, and ultimately improve educational outcomes. Whether it is for educators looking to streamline their work, students aiming to improve their performance, or institutions striving for better - informed decisions, Zeraki Analytics is an invaluable tool in the educational landscape.