Profiler App Introduction
Introduction
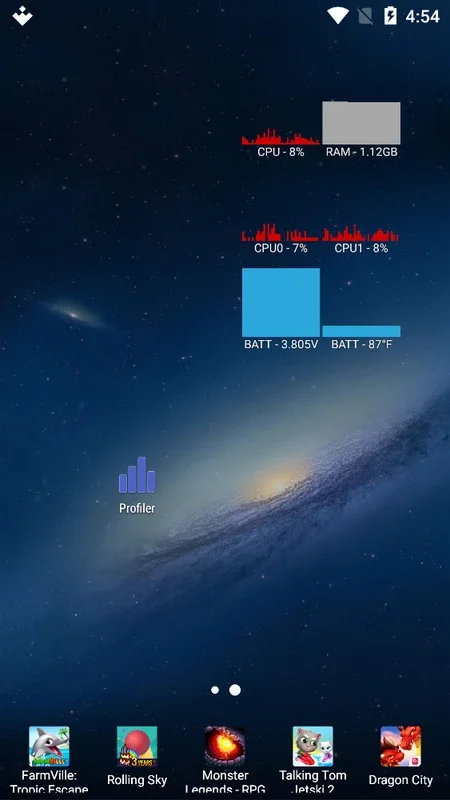
Profiler is an innovative application designed specifically for Android devices. It serves as a powerful tool for users who are interested in closely monitoring the performance of their Android devices. This app provides a detailed view of various aspects of the device's operation, allowing users to make informed decisions about their device usage and performance optimization.
Monitoring Capabilities
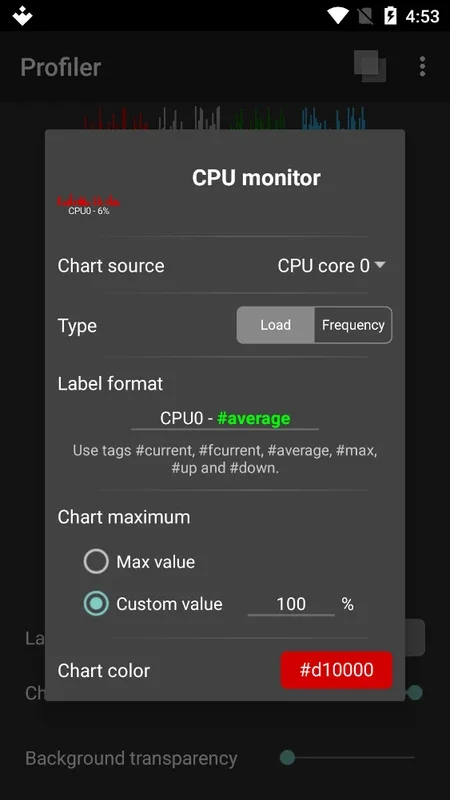
One of the most remarkable features of Profiler is its ability to monitor multiple components of an Android device in real - time. It can keep a close eye on the CPU frequency. This is crucial as the CPU frequency directly impacts the speed and responsiveness of the device. For instance, if you notice that the CPU frequency is constantly high while running a particular app, it might indicate that the app is resource - intensive and could potentially drain your battery faster.
The GPU workload is another aspect that Profiler can monitor. The GPU is responsible for handling graphics - related tasks, such as rendering images and videos. By monitoring the GPU workload, users can determine if a particular application, such as a graphically - intensive game, is putting too much strain on the GPU. This information can be useful for users who want to optimize their device's performance for gaming or other graphics - heavy applications.
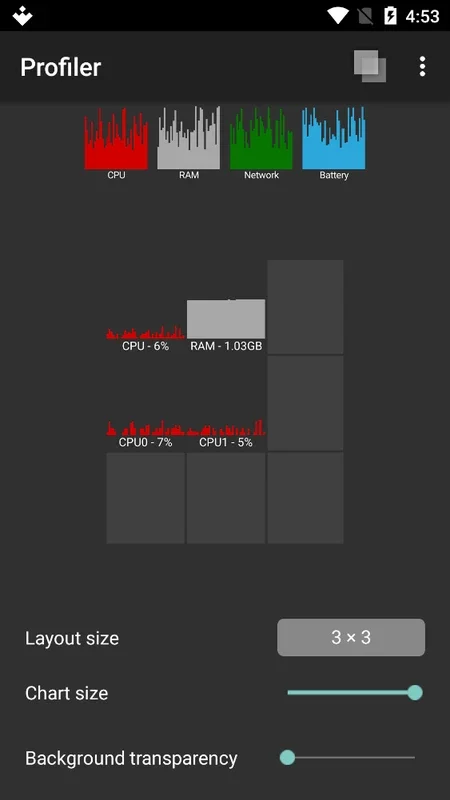
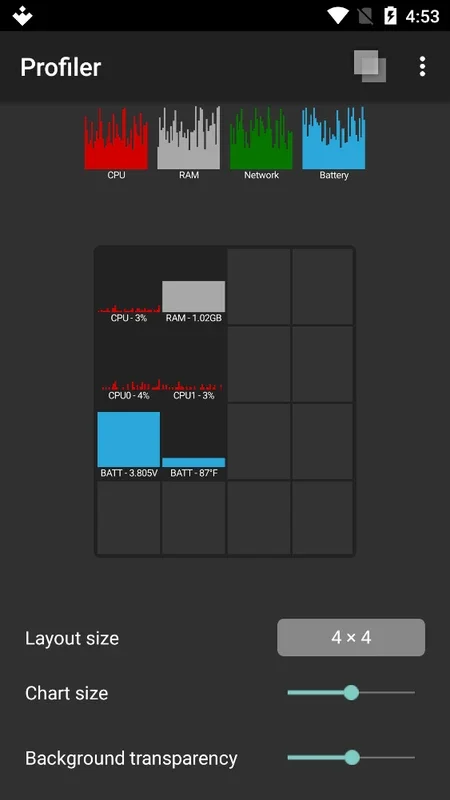
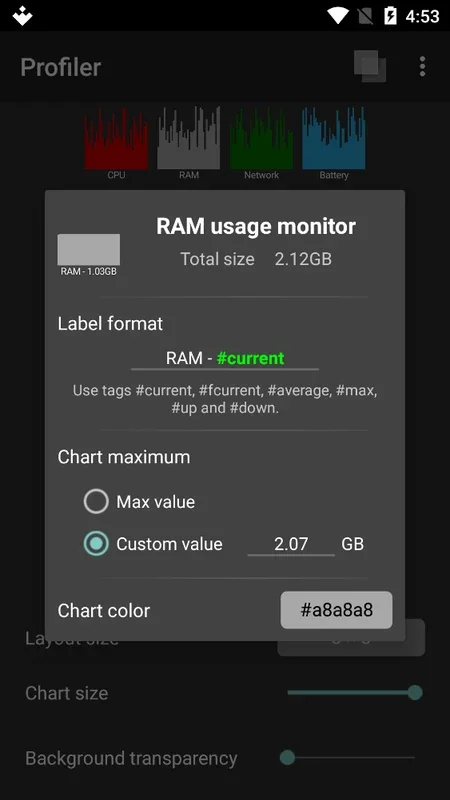
Memory usage on the RAM is also a key area of focus for Profiler. As we all know, the amount of available RAM can significantly affect the overall performance of an Android device. If too many applications are running simultaneously and consuming a large amount of RAM, the device may start to slow down. Profiler allows users to see exactly how much memory is being used at any given time, enabling them to close unnecessary applications and free up RAM for better performance.
Network consumption is yet another important parameter that Profiler can track. In today's world, where we are constantly connected to the internet, it is essential to keep an eye on how much data our applications are using. Profiler provides detailed information about network consumption, which can be helpful for users who have limited data plans or want to optimize their device's network usage.
Temperature and voltage are also monitored by Profiler. High temperatures can be a sign of overheating, which can potentially damage the device or lead to performance issues. By keeping track of the temperature and voltage, users can take appropriate measures to prevent overheating, such as closing resource - intensive applications or removing the device from a hot environment.
The Dashboard Advantage
Profiler's full dashboard is a standout feature. It presents all the monitored parameters in a clear and visible manner, right on the desktop. This means that users do not have to navigate through multiple menus or screens to access the information they need. The dashboard provides a quick and easy - to - understand overview of the device's performance at a glance.
For example, when you launch a game, you can immediately see on the dashboard how the game affects various aspects of your device's performance. You can see if the CPU frequency spikes, how much the GPU workload increases, and how much memory the game is consuming. This real - time information allows you to make decisions on the fly, such as adjusting the game's settings to optimize performance or closing other applications to free up resources.
Performance Optimization
By using Profiler, users can take proactive steps to optimize the performance of their Android devices. For instance, if they notice that a particular application is consuming a large amount of memory or causing the CPU to run at a high frequency, they can choose to uninstall the app if it is not essential or look for alternative, more lightweight applications.
In the case of network consumption, users can identify which applications are using the most data and limit their usage if necessary. They can also adjust their device's settings to reduce background data usage, which can help save on data costs and improve overall network performance.
When it comes to temperature and voltage, if Profiler indicates that the device is getting too hot, users can take steps to cool it down. This could include removing the device from a case that may be trapping heat or reducing the usage of resource - intensive applications until the device cools off.
Conclusion
Profiler is an invaluable app for Android users who are concerned about the performance of their devices. It offers a comprehensive set of monitoring capabilities and a user - friendly dashboard that makes it easy to keep track of various performance parameters. By using Profiler, users can optimize their device's performance, extend battery life, and ensure the long - term health of their Android devices.