PieChart Maker App Introduction
Introduction
PieChart Maker is a remarkable software that has been designed to simplify the process of creating pie charts. It is a tool that caters to a wide range of users, from students who need to present data in their academic projects to professionals who require effective data visualization in their work.
Features of PieChart Maker
User - Friendly Interface
The user - friendly interface of PieChart Maker is one of its most appealing aspects. It allows users to easily generate pie charts without any prior technical knowledge. The process is straightforward, and users can quickly input their data and create a basic chart. This simplicity makes it accessible to those who may not be well - versed in complex data visualization tools.
Customization Options
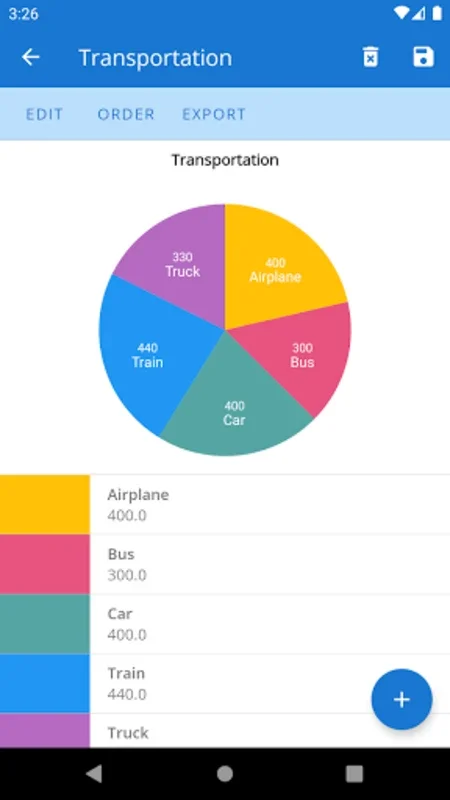
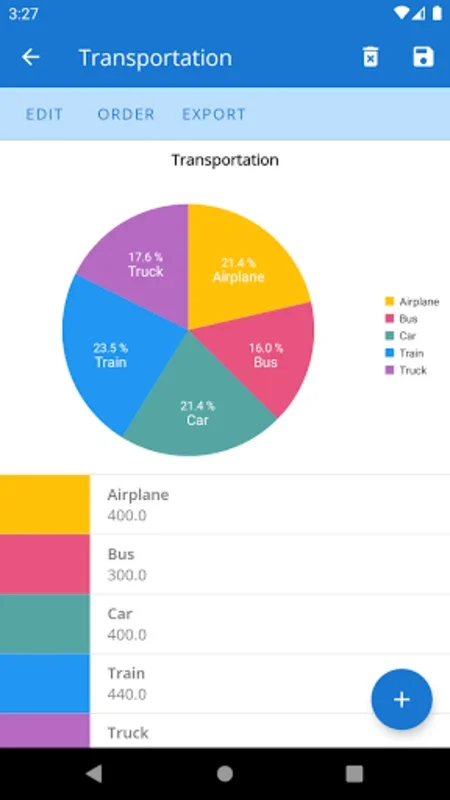
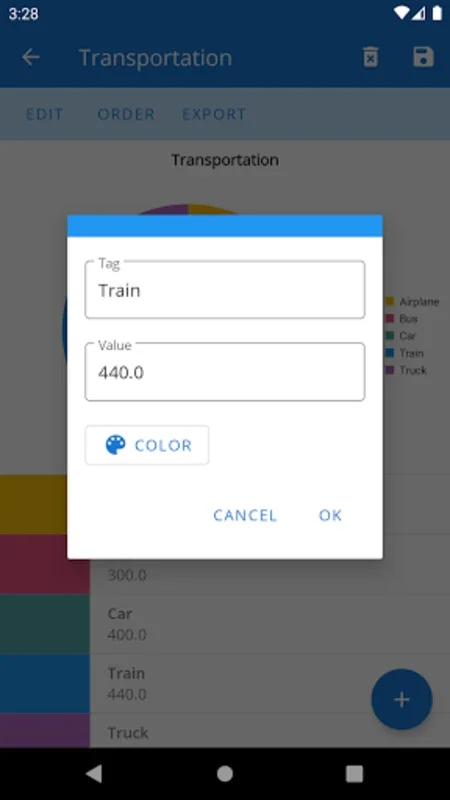
PieChart Maker offers a plethora of customization options. Users can adjust the color schemes of their pie charts to match their presentation or report themes. They can also toggle the titles on or off, depending on their needs. This level of customization ensures that each chart is unique and tailored to the specific requirements of the user.
Saving and Re - Editing
Another great feature is the ability to save and re - edit charts. Once a chart is created, it can be saved for future use. If there are any changes required, the user can easily re - open the chart and make the necessary adjustments. This is extremely useful for those who may need to update their data or make cosmetic changes to their charts over time.
Sharing Capabilities
The sharing capabilities of PieChart Maker are quite versatile. It allows users to export their charts in popular formats such as images, Excel files, and JSON files. This means that the charts can be easily integrated into various types of documents or shared with colleagues and clients. For example, if a user wants to include a pie chart in a PowerPoint presentation, they can export it as an image and insert it seamlessly.
Why PieChart Maker is Ideal for Different Users
For Students
Students often need to present data in a clear and concise manner in their academic projects. PieChart Maker provides them with an easy - to - use tool to create visual representations of their data. For instance, in a science project where they are analyzing the composition of different elements in a sample, they can use PieChart Maker to create a pie chart that clearly shows the proportions. This not only makes their presentations more engaging but also helps in better understanding of the data.
For Professionals
Professionals in various fields such as business, finance, and marketing also benefit from PieChart Maker. In the business world, for example, when analyzing market share or revenue distribution among different products or services, a pie chart can be a very effective way to present the data. PieChart Maker allows them to create professional - looking charts quickly and customize them to fit their corporate branding.
Comparison with Other Chart - Making Tools
PieChart Maker stands out when compared to other chart - making tools. Some other tools may be more complex and require a steeper learning curve. In contrast, PieChart Maker focuses on simplicity and ease of use. While some tools may offer more advanced features for very specialized data visualization needs, PieChart Maker provides all the essential features that most users need for creating basic to moderately complex pie charts.
Conclusion
In conclusion, PieChart Maker is an excellent choice for anyone in need of creating pie charts. Its combination of a user - friendly interface, customization options, saving and re - editing capabilities, and versatile sharing options make it a very practical tool. Whether you are a student or a professional, it can enhance the way you present data and make your information more impactful. It simplifies the process of data visualization and interpretation, which is crucial in today's data - driven world.