Candlestick Signals and Patterns App Introduction
Introduction
Candlestick Signals and Patterns is an Android application that has been designed to be a valuable asset for investors. It focuses on Japanese Candlestick charting and analysis, which is a fundamental aspect of technical analysis in the financial markets. This application is not just for the seasoned investors but also for those who are new to the world of technical charting. It aims to provide a platform where users can enhance their understanding of market signals and make more informed investment decisions.
Understanding Candlestick Charting
Candlestick charts are a graphical representation of price movements in the financial markets. They are composed of individual "candles" which represent a specific time period. Each candle has a body and wicks (or shadows). The body represents the opening and closing prices, while the wicks show the high and low prices during that time period. Understanding these candlestick formations is crucial as they can provide insights into market sentiment. For example, a long bullish candle may indicate strong buying pressure, while a long bearish candle may suggest significant selling pressure. Candlestick Signals and Patterns app delves deep into these formations, helping users to recognize patterns that can signal potential market reversals or continuations.
The Stochastic Indicator
The app also features the stochastic indicator, which is a powerful tool in technical analysis. This indicator compares a particular closing price of a security to a range of its prices over a certain period. It helps in determining whether the market is overbought or oversold. When combined with the candlestick signals, it provides a more comprehensive view of the market. For instance, if the stochastic indicator shows that the market is overbought and at the same time, a bearish candlestick pattern forms, it could be a strong signal of an impending market reversal. This combination of tools in the Candlestick Signals and Patterns app gives users an edge in their trading decisions.
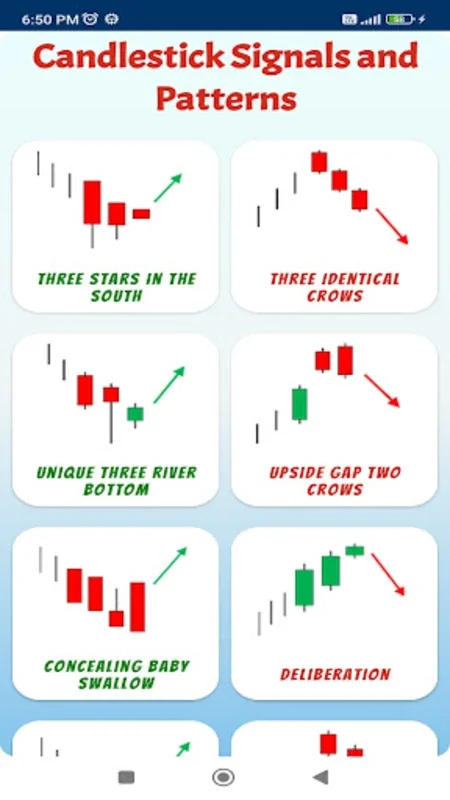
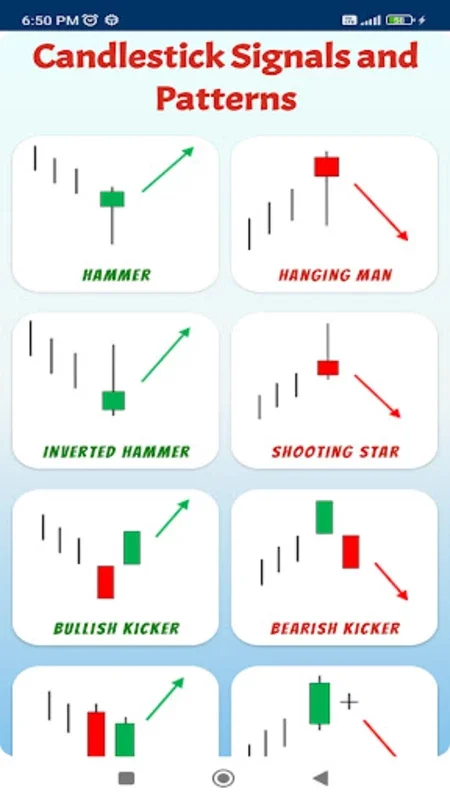
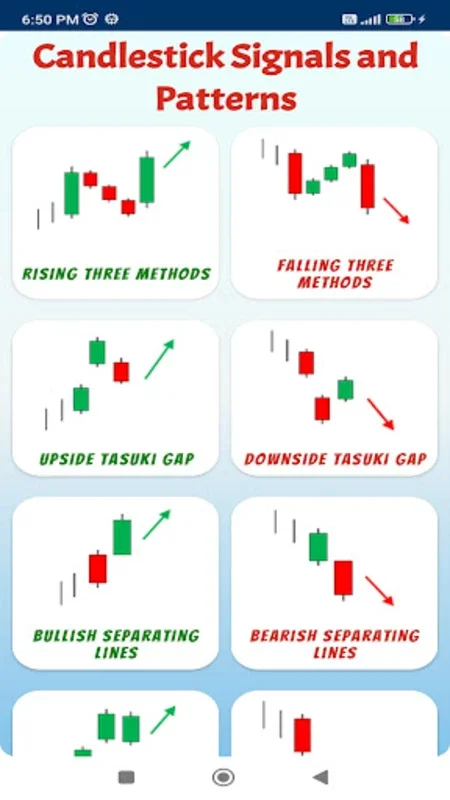
Candlestick Signals and Patterns
There are over 70 candlestick signals included in the app. These signals are graphical formations that can indicate potential changes in the market direction. Some of the major signals include doji, hammer, shooting star, and engulfing patterns. The doji, for example, is a signal that can indicate indecision in the market. A hammer pattern, on the other hand, can signal a potential reversal from a downtrend to an uptrend. The app provides detailed illustrations of these signals, making it easier for users to identify them in real - time market charts. By understanding these signals and patterns, users can anticipate market movements and adjust their trading strategies accordingly.
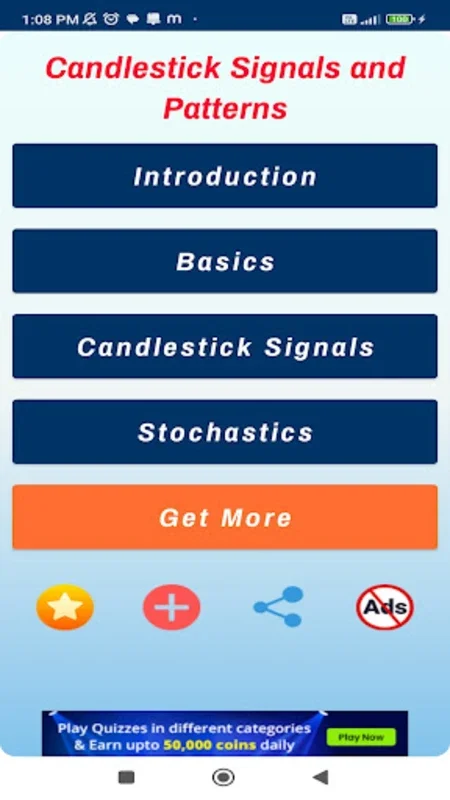
User - Friendliness of the App
One of the key aspects of the Candlestick Signals and Patterns app is its user - friendliness. The interface is designed in such a way that even those who are new to technical analysis can easily navigate through the app. The charts are presented clearly, and the explanations of the signals and patterns are easy to understand. This makes it accessible to a wide range of users, from beginners who are just starting to learn about technical analysis to experienced traders who want to add another tool to their trading arsenal.
Importance for Investors
For investors, this app can be a game - changer. By providing accurate and timely information about candlestick signals and the stochastic indicator, it enables them to make more informed investment decisions. In the highly volatile world of the stock market, having access to such tools can mean the difference between making a profitable trade and incurring a loss. Whether you are a day trader, swing trader, or a long - term investor, understanding these technical indicators can help you better manage your portfolio and increase your chances of success.
Comparison with Other Technical Analysis Tools
While there are many technical analysis tools available in the market, the Candlestick Signals and Patterns app stands out for its focus on candlestick charting and the inclusion of the stochastic indicator. Some other tools may offer more complex features, but this app is designed to be simple and straightforward, making it ideal for those who want to quickly understand and apply these basic yet powerful technical analysis concepts. It does not overwhelm the user with too many unnecessary features, but rather focuses on providing the essential tools for effective trading.
Conclusion
In conclusion, Candlestick Signals and Patterns is a must - have app for anyone interested in technical analysis in the financial markets. It offers a comprehensive set of tools, including over 70 candlestick signals and the stochastic indicator, all presented in a user - friendly interface. Whether you are a novice or an experienced investor, this app can help you enhance your trading skills and make more informed investment decisions. By using this app, you can gain a better understanding of market signals and patterns, which can ultimately lead to increased profitability in your trading activities.